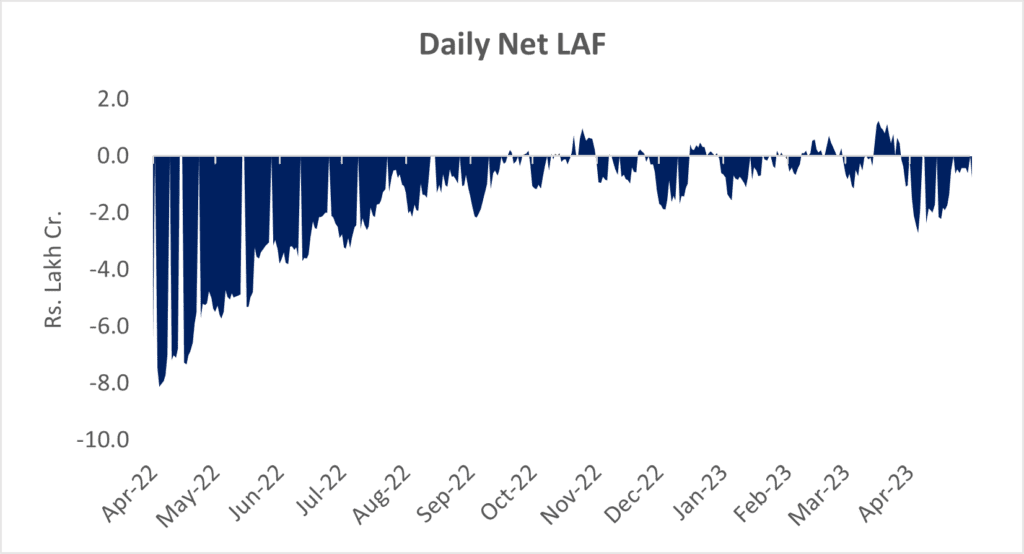
Average daily absorptions under the LAF window was down almost 75% in Mar’23 (Rs. 1,190 crore vs Rs. 4,777 crore in Feb’23). Long term durable liquidity worth ~Rs. 73,000 crore provided under long term repos is scheduled for maturity in March and April 2023.
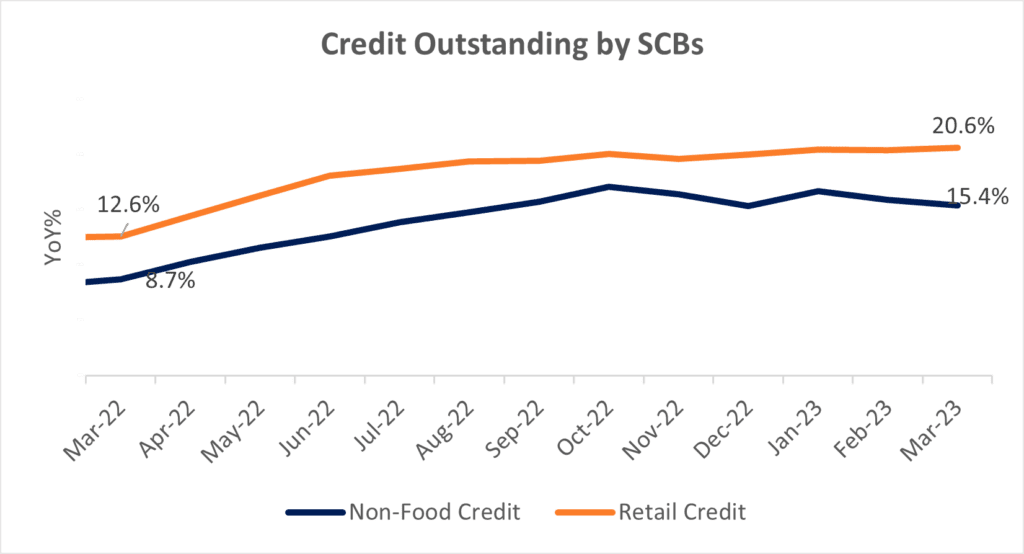
Personal loans witnessed an on-year growth of 20.4% in Feb’23, led by growth in advances against fixed deposits, growing 43% (YoY).
Credit to services sector witnessed double-digit growth of 20.7% in Feb’23, with loans extended to NBFCs growing at the fastest pace of 32.4%.
Inflation
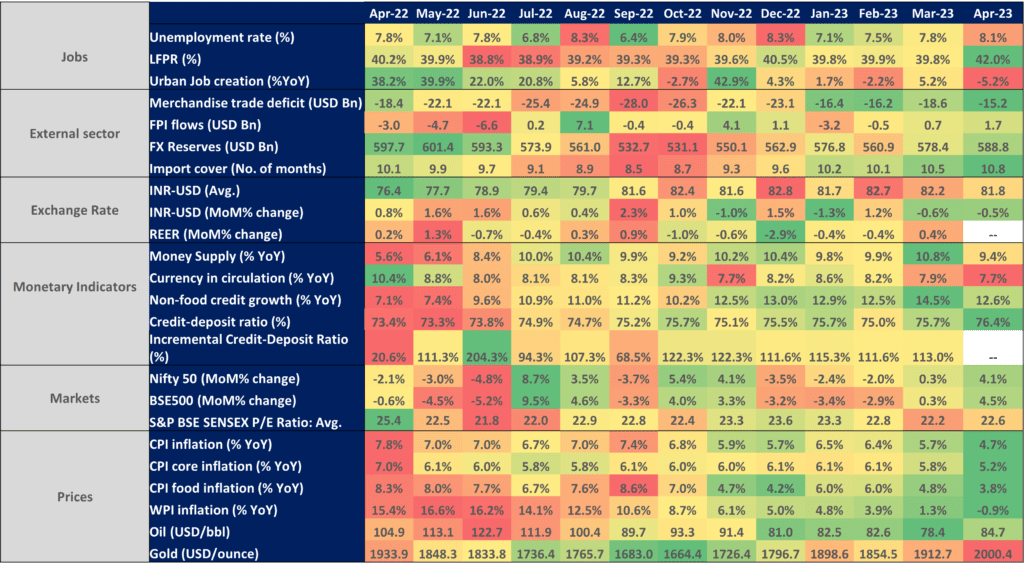
CPI inflation for Apr’23 came in at an 18-month low of 4.7%. Food inflation softened to 3.8%. Over one-thirds of the food price index was in deflationary zone in Apr’23. However, certain food items – cereals and spices, with a weightage of ~12% are still experiencing double-digit inflation. Core inflation (excluding food and fuel) too, moderated to 5.2% in Apr’23 (lowest in last 35 months) vs 5.8% in Mar’23.
WPI (a proxy for input cost), stood at a 33-month low of -0.92% in Apr’23 on account of a de-growth of 2.4% in manufactured products and softening inflation in primary articles (food) and fuel and power to 1.6% and 0.93% respectively.
With CPI inflation falling within the RBI’s tolerance band (4%-6%) and the tone of last Fed policy, the RBI is likely to keep rates on hold in its Jun’23 policy. Falling WPI should offer further comfort to CPI levels in the coming few months. Headwinds to inflation, stem from weather disturbances. Weather forecasting agency Skymet has predicted a delay in monsoon for FY24 which may not augur well for Kharif sowing and food prices.
Foreign Exchange
The rupee appreciated by 0.7% against the U.S. dollar in Apr’23. Broad fundamental reasons (softening global commodity prices, reducing current account deficit (CAD) and healthy foreign portfolio investments) have contributed to the recent appreciation of the rupee and these are likely to sustain.
Net FPI inflows in Indian capital markets in Apr’23 stood at USD 1.7 Bn compared to USD 0.7 Bn in the previous month. The dollar index eased slightly in Apr’23 to 101.8 vs 103.8 in Mar’23.
While the rupee has an appreciating bias basis fundamentals, the RBI is likely to build up on its forex reserves and prevent any strong appreciation of the currency.
India’s merchandise trade deficit narrowed to USD 15 Bn in Apr’23 from USD 19 Bn in Mar’23 led by a USD 10 Bn fall in imports. Services trade balance moderated to USD 13.9 Bn in Apr’23 on account of a marginal decline in exports. Petroleum, agriculture and capital-intensive products were among the highest exported commodities in Mar’23.
Core (non-oil and non-gold) imports witnessed a de-growth of 12.5% on-year in Apr’23. Core imports growth has been in contractionary zone since the start of 2023, suggesting a slowdown in domestic demand.
Given the weak economic outlook of India’s key export markets, export growth is likely to remain muted in the fiscal. A relatively weak rupee will lend support to exports.
Industrial Activity
Growth in Index of Industrial Production slowed to 1.1% in Mar’23 compared to 5.8% in Feb’23. This was on account of a slowdown in manufacturing activity to 0.48%, compared to 5.6% the month before. IIP growth throughout FY23 stood at 5.4% vs 7.4%* in FY22.
Slowing domestic demand explains the de-growth in consumer durables to 8.4% on-year in Mar’23 compared to a de-growth of 4.1% in Feb’23. The same pattern is reflected in falling core imports. Continued thrust on capex and construction activity led to a growth in infrastructure and construction goods output and capital goods output (5.4% and 8.1% YoY respectively).
Wearing apparel, computer electronics and furniture products witnessed the sharpest de-growth within manufacturing activity at 30.6%, 28% and 9.5%.
Source: TruBoard Research, CMIE, *Apr’21 YoY excluded for calculating IIP for FY22.
Team: Anuj Agarwal, Chief Economist Ria Rattanpal, Research Associate
Team: Anuj Agarwal, Chief Economist Ria Rattanpal, Research Associate
Disclaimer
The data and analysis covered in this report of TruQuest has been compiled by TruBoard Pvt Ltd and its associates (TruBoard) based upon information available to the public and sources believed to be reliable. Though utmost care has been taken to ensure its accuracy, no representation or warranty, express or implied is made that it is accurate or complete. TruBoard has reviewed the data, so far as it includes current or historical information which is believed to be reliable, although its accuracy and completeness cannot be guaranteed. Information in certain instances consists of compilations and/or estimates representing TruBoard’s opinion based on statistical procedures, as TruBoard deems appropriate. Sources of information are not always under the control of TruBoard. TruBoard accepts no liability and will not be liable for any loss of damage arising directly or indirectly (including special, incidental, consequential, punitive or exemplary) from use of this data, howsoever arising, and including any loss, damage or expense arising from, but not limited to any defect, error, imperfection, fault, mistake or inaccuracy with this document, its content.