TruQuest-Logo-Colour

Macro Watch

Update on Data Trends | February 2022

Macro Heat Map

India’s strict lockdown to restrain Omicron slowed the economic healing process

Heat Map February 2022

    • India’s lockdown intensity, as measured by University of Oxford, was 84 by end of Jan’22, compared to 56 in US, 42 in UK, 62 in Brazil and 42 in South Africa.
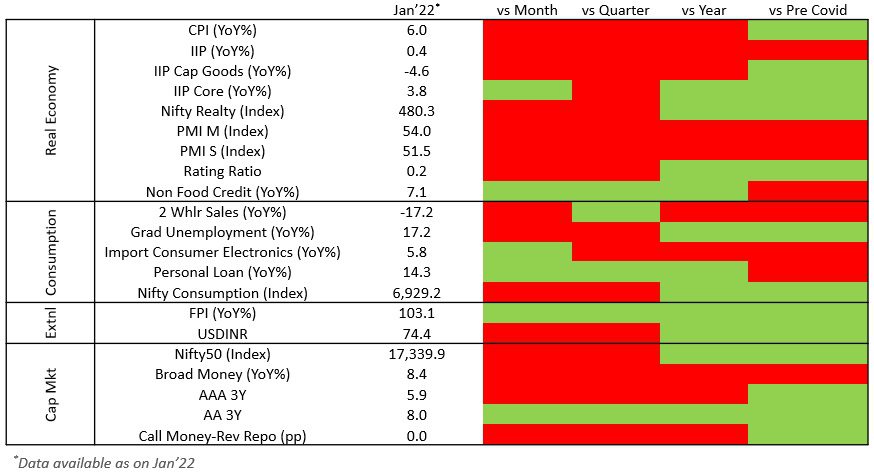
    • Indian economic recovery remained subdued in Jan’22. Strict lockdowns, despite localized, had a severe impact on day-to-day economic activity culminating into weakening macro indicators.
    • Industrial units, especially MSMEs, are running with significantly low levels of capacity utilization, employment levels and productivity as measured by Index of Industrial Production (IIP). Heavy wholesale and retail price inflation and interest expenses coupled with low sales are squeezing margins for manufacturers.
    • While exporting industries remain a beacon of hope, rising global competition, high raw material prices and expensive capital could become severe impediments unless supported with judicious fiscal policy interventions.
    • The building stresses within real economy are mirrored in the capital markets, especially the debt market. Surging yield spreads, decoupling with RBI’s signaling, rising costs of borrowing and volatile equity markets are early warning signals of upcoming financial stress.

Source: TruBoard Research, CMIE, Oxford University Lockdown Stringency Index

Industrial Activity

Ongoing lockdowns, surging input prices and energy costs are major impediments for manufacturing in Jan and Feb’22. We expect Mar’22 onwards to be better, assuming no new scares e.g., deltacron or military conflict in East Europe.

Industrial Activities feb22

  • Government estimates suggest manufacturing activity shrunk by 0.14% in Dec’21 (YoY). The sector has been slowing down once again since Aug’21.
  • A slowdown in manufacturing has set off a vicious economic cycle owing to its contribution to GDP (20%) and employment (26%). Quick policy support is required to reinvigorate India’s MSMEs (driving manufacturing and employment) to restore them to pre-2017 levels. (Indian economy has been on a steady slowdown since 2017)
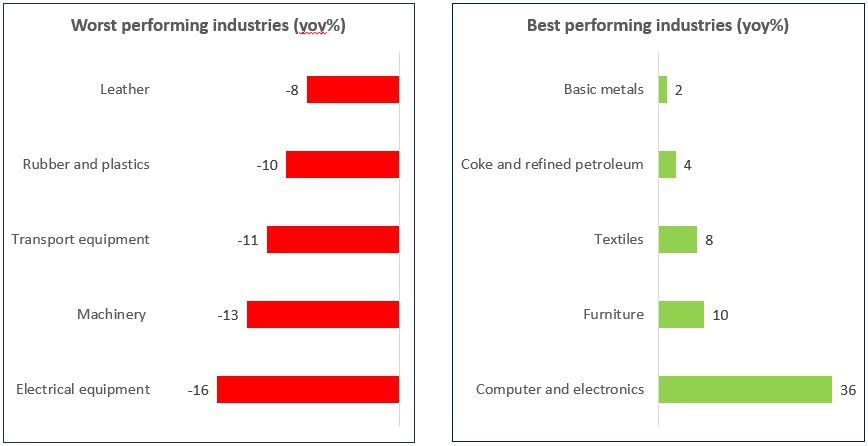
  • Government estimates further suggest persistent slowdown in production of machineries and heavy equipment (see chart), which is a fallout of reduced private capex. Lack of business expansion will not only take a toll on employment and growth but will also lead to a fresh round of nonperforming assets related problem within the fragile financial system. At a time when liquidity (global and domestic) is expected to dry, such risks can quickly turn into a contagion of bankruptcies and insolvencies.
  • A sharp rise in global demand, especially in USA and UK (pent up demand) and a China+1 strategy adopted by global manufacturers presents an opportunity for Indian merchandise exporters. Swift policy support and short-term regulatory forbearances can help them capitalize this momentary window of opportunity.

Source: TruBoard Research, CMIE, Oxford University Lockdown Stringency Index

Credit Rating Optimism Index

Economic activity expected to regain strength by mid Feb’22

Credit Rating Optimism index feb22

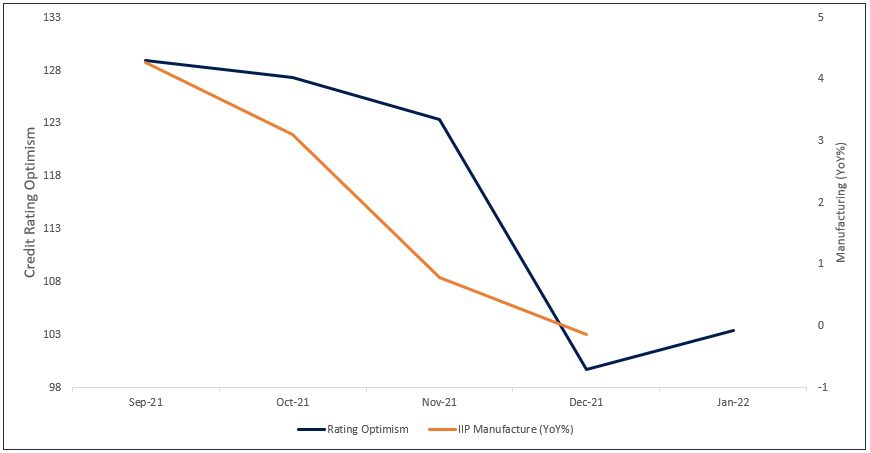
  • The TruBoard Rating Optimism measures the rise or fall in optimism among major rating agencies, compared to a base period (Jun’17). Empirical analysis suggest rating outlook serves as an early warning signal for economic activity.
  • There is a strong causality between the Index (lead) and industrial production (manufacturing) levels in India. The marginal uptick in the Rating Index in Jan’22, if sustained, can be an early sign of a possible recovery in manufacturing in Q4 FY22.

Source: TruBoard Research, CMIE, Oxford University Lockdown Stringency Index

TruBoard Macro Forecasts

Q4 FY22Q1 FY23Q3 FY23
Real GDP (%)5.07.06.5
Retail Inflation (%)5.85.75.5
Repo Rate (%)4.04.34.5
10 Year Gsec (%)6.76.97.0
USDINR75.376.075.6
Q4 FY22Q1 FY23Q3 FY23
Real GDP (%)5.07.06.5
Retail Inflation (%)5.85.75.5
Repo Rate (%)4.04.34.5
10 Year Gsec (%)6.76.97.0
USDINR75.376.075.6

Consensus Forecasts (RBI Panel of Forecasters)

Q4 FY22Q1 FY23Q3 FY23
Real GDP (%)5.014.95.5
Retail Inflation (%)5.85.14.7
Repo Rate (%)4.04.34.5
USDINR75.076.576.0

Consensus Forecasts (RBI Panel of Forecasters)

Q4 FY22Q1 FY23Q3 FY23
Real GDP (%)5.014.95.5
Retail Inflation (%)5.85.14.7
Repo Rate (%)4.04.34.5
USDINR75.076.576.0

Information Product Descriptions:

Heat Map: Graphical representation of indicator trends denoted by colour code. Green depicts current reading of an economic indicator is stronger than the previous period (month/quarter/year/2 years). Red signifies the opposite. The economic indicators have been carefully curated to reflect those trends with the highest co-incidental statistical significance on India’s overall economic activity.

Credit Rating Optimism Index: The index reflects the rise or fall in optimism among major credit rating agencies in India. Optimism is denoted by an Optimism score and is calculated as the ratio of Upgrades and Reaffirmations awarded to the total number of entities rated within a specified time period. The optimism score at any point of time is indexed to the score generated in the base period of June 2017 to arrive at the TruBoard Credit Rating Optimism Index. The Base period index level is fixed at 100. Hence any Index level higher than 100 suggests optimism levels in the corresponding period is higher than the base period and vice versa.

Optimism Score = ( Upgrades + Reaffirmations ) / ( Upgrades + Reaffirmations + Downgrades )

Download report as PDF 

TruQuest-Logo-Colour

TruQuest is knowledge series launched by TruBoard Partners providing succinct updates and views on:

  • Liquidity outlook
  • India’s macro economic view
  • Trends within the infrastructure, Real Estate and Renewable Energy sectors
  • Impact analysis of new regulations and policies on lending and capital flow
Reach out to us at research@truboardpartners.com

Author: Debopam Chaudhuri, Head of Research and Ratings
+91-9819239926, dc@truboardpartners.com

Author: Debopam Chaudhuri
Head of Research and Ratings
+91-9819239926
dc@truboardpartners.com

Disclaimer

The data and analysis covered in this report of TruQuest has been compiled by TruBoard VT Pvt Ltd and its associates (TruBoard) based upon information available to the public and sources believed to be reliable. Though utmost care has been taken to ensure its accuracy, no representation or warranty, express or implied is made that it is accurate or complete. TruBoard has reviewed the data, so far as it includes current or historical information which is believed to be reliable, although its accuracy and completeness cannot be guaranteed. Information in certain instances consists of compilations and/or estimates representing TruBoard’s opinion based on statistical procedures, as TruBoard deems appropriate. Sources of information are not always under the control of TruBoard. TruBoard accepts no liability and will not be liable for any loss of damage arising directly or indirectly (including special, incidental, consequential, punitive or exemplary) from use of this data, howsoever arising, and including any loss, damage or expense arising from, but not limited to any defect, error, imperfection, fault, mistake or inaccuracy with this document, its content.