
Macro Watch
Update on Data Trends | April 2022
Macro Heat Map
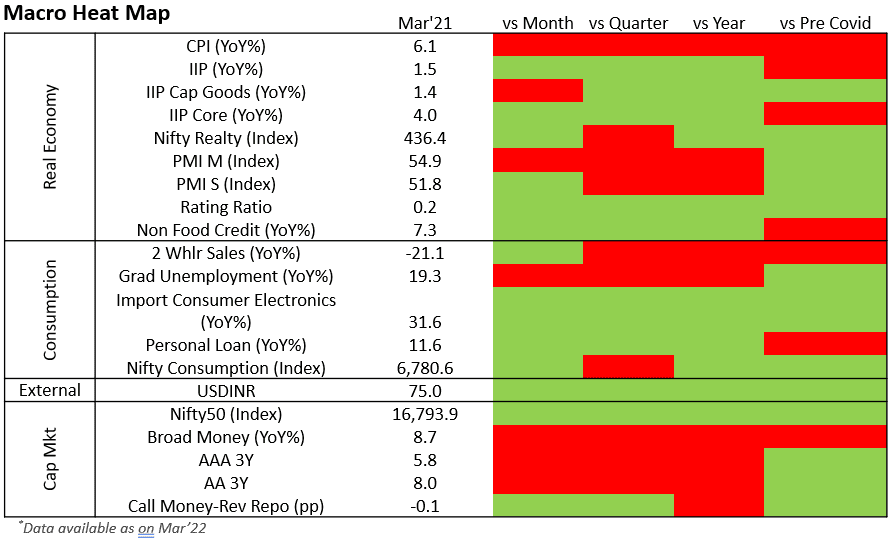
Inflationary trends weaken India’s post COVID recovery. Prolonged elevated food, clothing and energy costs will adversely impact fiscal deficit and capital costs in FY23.
- Indian economic activity is witnessing a nascent turnaround. Evidence from the grass roots like higher electricity demand from industrial regions and higher railway freight revenues point to that. Peak electricity demand in Mar’22 was 26% higher than Mar ‘20 (pre-covid). Electricity production is up 20% and rail freight revenue is higher by 34% in Mar’22 compared to Mar’20. However, freight revenue from transferring coal to thermal power plants increased by only 12% suggesting a stretch on coal supplies, which, among other factors, can potentially derail this rising momentum.
- Prevailing inflationary trend is the biggest risk to a wholesome economic recovery, globally.
- India is no exception. Rating agency, Fitch, slashed India’s FY23 GDP growth expectation by 180 bps (from what was estimated prior to the Ukraine-Russia conflict). World Bank reduced it by 70 bps. Even Reserve Bank of India (RBI) reduced its growth forecast by 60 bps to 7.2% in FY23.
- It is necessary to control India’s inflation through government interventions. Prolonged inflation will have severe political and economic consequences. Food inflation breached 6% for the first time in 16 months in Mar’22. Unless controlled, soon high food prices will dent political stability, especially with key states like Gujarat, Rajasthan and Himachal Pradesh bound for polls within the next 12 months . Similarly, if Indian price levels remain sticky while global prices start inching down, the export sector tailwinds prevailing now will quickly transform into headwinds leading to a gaping current account deficit for India.
- With sticky inflationary expectations India has already shifted to a higher interest rate regime. In-fact the benchmark rate, i.e.10 Year Government security rose by 80bps since Dec’21. RBI will eventually raise policy rates, at a much more aggressive pace than earlier expected, with 150-200 bps rise in Repo rate by Q2 FY24.
Industrial Activity

The manufacturing sector is witnessing renewed challenges in the form of high prices at factory gate (producer price inflation). Limited room to pass costs in an economy faced with weak demand is leading to thinner margins and weaker balance sheets.
- Rising cost of capital is adding to the woes of the manufacturing sector with Small and Medium Enterprises (SMEs) once again finding it tough to raise working capital to sustain.
- Though capacity utilisation (CU) in the manufacturing sector recovered to 72.4% by Q3 FY22 from 68.3% Q2 FY22, we expect it to once again decline in Q1 FY23. Consequently, and significant revival in private capex will be delayed.
- Manufacturing companies could witness the following headwinds at varying intensities over the next 2-3 quarters:
- Reduced global and domestic demand as consumption wanes amidst heavy inflation.
- Liquidity tightens and capital costs rise further.
- Energy costs including fossil fuels and electricity remain elevated
- Likely rise in wage inflation of skilled employees.
- Rising cost of capital is adding to the woes of the manufacturing sector with Small and Medium Enterprises (SMEs) once again finding it tough to raise working capital to sustain.
- Though capacity utilisation (CU) in the manufacturing sector recovered to 72.4% by Q3 FY22 from 68.3% Q2 FY22, we expect it to once again decline in Q1 FY23. Consequently, and significant revival in private capex will be delayed.
- Manufacturing companies could witness the following headwinds at varying intensities over the next 2-3 quarters:
- Reduced global and domestic demand as consumption wanes amidst heavy inflation.
- Liquidity tightens and capital costs rise further.
- Energy costs including fossil fuels and electricity remain elevated.
- Likely rise in wage inflation of skilled employees.
Credit Rating Optimism Index
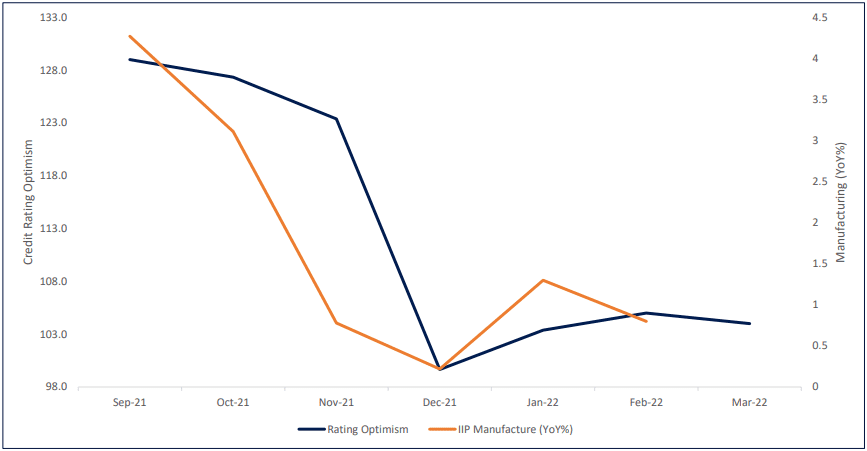
TruBoard Credit Rating Optimism Index’s strong correlation with India’s manufacturing activity makes it an effective early warning signal for manufacturing sector.
- Manufacturing activity (IIP-Manufacture) is mimicking the trend charted by the TruBoard Index. The Index had predicted a better manufacturing data for Jan’22 followed by a tepid Feb’22. The Index now predicts that manufacturing in Mar’22 data is expected to remain weaker compared to Feb’22 levels.
- The strong correlation is guided by the fact that the TruBoard Index captures sentiment of rating agencies on MSMEs, which is the driving force behind Indian manufacturing.
TruBoard Macro Forecasts
| Q1 FY23 | Q2 FY23 | FY23 | |
|---|---|---|---|
| Real GDP (%) | 8.0 | 6.5 | 6.7 |
| Retail Inflation (%) | 6.1 | 5.8 | 5.2 |
| Repo Rate (%) | 4.0 | 4.25 | 4.5 |
| 10 Year Gsec (%) | 7.15 | 7.25 | 7.25 |
| USDINR | 76.5 | 75.5 | 75.5 |
| Q1 FY23 | Q2 FY23 | FY23 | |
|---|---|---|---|
| Real GDP (%) | 8.0 | 6.5 | 6.7 |
| Retail Inflation (%) | 6.1 | 5.8 | 5.2 |
| Repo Rate (%) | 4.0 | 4.25 | 4.5 |
| 10 Year Gsec (%) | 7.15 | 7.25 | 7.25 |
| USDINR | 76.5 | 75.5 | 75.5 |
Consensus Forecasts (RBI Panel of Forecasters)
| Q1 FY23 | Q2 FY23 | FY23 | |
|---|---|---|---|
| Real GDP (%) | 14 | 6.4 | 7.5 |
| Retail Inflation (%) | 5.8 | 5.9 | 5.6 |
| Repo Rate (%) | 4.0 | 4.25 | 4.5 |
| USDINR | 77.0 | 77.0 | 76.5 |
Consensus Forecasts (RBI Panel of Forecasters)
| Q1 FY23 | Q2 FY23 | FY23 | |
|---|---|---|---|
| Real GDP (%) | 14 | 6.4 | 7.5 |
| Retail Inflation (%) | 5.8 | 5.9 | 5.6 |
| Repo Rate (%) | 4.0 | 4.25 | 4.5 |
| USDINR | 77.0 | 77.0 | 76.5 |
Information Product Descriptions:
Heat Map: Graphical representation of indicator trends denoted by colour code. Green depicts current reading of an economic indicator is stronger than the previous period (month/quarter/year/2 years). Red signifies the opposite. The economic indicators have been carefully curated to reflect those trends with the highest co-incidental statistical significance on India’s overall economic activity.
Credit Rating Optimism Index: The index reflects the rise or fall in optimism among major credit rating agencies in India. Optimism is denoted by an Optimism score and is calculated as the ratio of Upgrades and Reaffirmations awarded to the total number of entities rated within a specified time period. The optimism score at any point of time is indexed to the score generated in the base period of June 2017 to arrive at the TruBoard Credit Rating Optimism Index. The Base period index level is fixed at 100. Hence any Index level higher than 100 suggests optimism levels in the corresponding period is higher than the base period and vice versa.
Optimism Score = ( Upgrades + Reaffirmations ) / ( Upgrades + Reaffirmations + Downgrades )
TruQuest is knowledge series launched by TruBoard Partners providing succinct updates and views on:
- Liquidity outlook
- India’s macro economic view
- Trends within the infrastructure, Real Estate and Renewable Energy sectors
- Impact analysis of new regulations and policies on lending and capital flow
Author: Debopam Chaudhuri, Head of Research and Ratings
+91-9819239926, dc@truboardpartners.com
Author: Debopam Chaudhuri
Head of Research and Ratings
+91-9819239926
dc@truboardpartners.com
Disclaimer
The data and analysis covered in this report of TruQuest has been compiled by TruBoard VT Pvt Ltd and its associates (TruBoard) based upon information available to the public and sources believed to be reliable. Though utmost care has been taken to ensure its accuracy, no representation or warranty, express or implied is made that it is accurate or complete. TruBoard has reviewed the data, so far as it includes current or historical information which is believed to be reliable, although its accuracy and completeness cannot be guaranteed. Information in certain instances consists of compilations and/or estimates representing TruBoard’s opinion based on statistical procedures, as TruBoard deems appropriate. Sources of information are not always under the control of TruBoard. TruBoard accepts no liability and will not be liable for any loss of damage arising directly or indirectly (including special, incidental, consequential, punitive or exemplary) from use of this data, howsoever arising, and including any loss, damage or expense arising from, but not limited to any defect, error, imperfection, fault, mistake or inaccuracy with this document, its content.