

Retail inflation render Indians poorer
Price Trends:
Inflationary pressures are rising in India in sync with the rest of the world. As per the latest retail inflation (CPI) data released by the Ministry of Statistics and Programme Implementation( MoSPI), inflation spiked to 6.95% in Mar’22 versus 6.07% in Feb‘22. The rate of inflation observed since Jan’22 has been beyond RBI’s tolerance level of 4% (+/1 2%).
Consumer and whole sale price levels have been at an elevated level across the globe. At 8.5% , USA is witnessing its highest level of retail inflation since 1981. This trend is primarily driven by post covid economic recuperations and additional supply chain disruptions caused by the Russia-Ukraine conflict.
The surge in food price inflation in India is typically worrying, as this has a direct impact on government measures to reduce poverty levels. The March inflationary trend can be attributed to a surge in food prices, which registered a 7.7 percent y-o-y growth in March as compared to 5.85% in February. This was in turn driven by oils and fats, vegetables, spices, and meat and fish prices which rose by 18.79%, 11.64%, 8.5% and 9.63% compared to same time last year, respectively.
The other major contributors to this price rise were clothing, which rose to 9.4 percent in March 2022 from 2.52 percent in February 2022 and fuel and light, rising to 7.52 percent in March 2022 from 2.34 percent in February 2022.
Interest rate impact:
Interest rates in India, especially bond yields had already spiked in recent weeks in anticipation of higher inflation. The Reserve Bank of India in its latest policy tried to catch up to the rising interest rate curve by replacing reverse repo with a higher Standing Deposit Facility (SDF).
Higher than 6% inflation for three consecutive months has put the RBI in a difficult space with regards policy rates. We expect a sharper rise in policy rates than earlier expected.
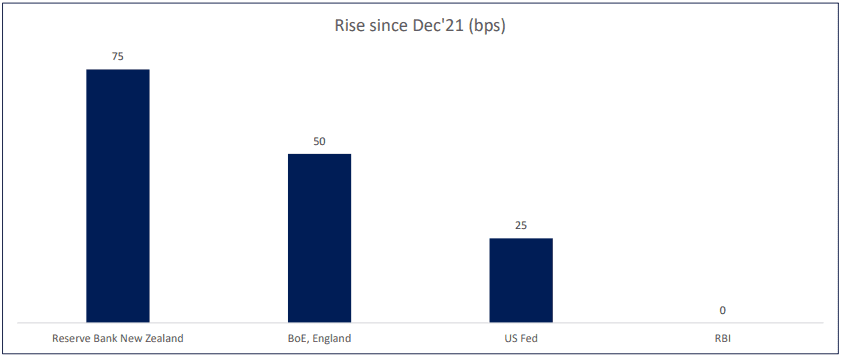
The 10-year G-sec benchmark rose by more than 80 bps since Dec’21 driven primarily by higher inflationary sentiment and increasingly normalizing global monetary policies. The Fed Reserve (USA) increased its interest rates from 0.25% in December 2021 to 0.5% in its last meeting held in April 2022. The Reserve Bank of New Zealand increased its interest rate to 1.5% in its April meeting in 2022 from 0.75% in December 2021. During the same time, the Bank of Engkland increased its policy rates from 0.25% to 0.75%.
Outlook:
We don’t expect inflationary trends to be any different in April and May’22, owing to sticky crude prices, high food prices and sustained bottlenecks in global supply chains. RBI will have to fall in line with its global peers in raising policy rates as early as June, or even earlier through a special meeting if need be. With Government bond auctions amounting to Rs 8.45 Lakh crores in H1 FY23, bond yields will witness sustained upward pressures and RBI will do well by giving a decisive direction amidst the uncertainties (by raising policy rates).
Chart 1: Retail inflation remains above RBI’s higher tolerance for 3 months in a row:
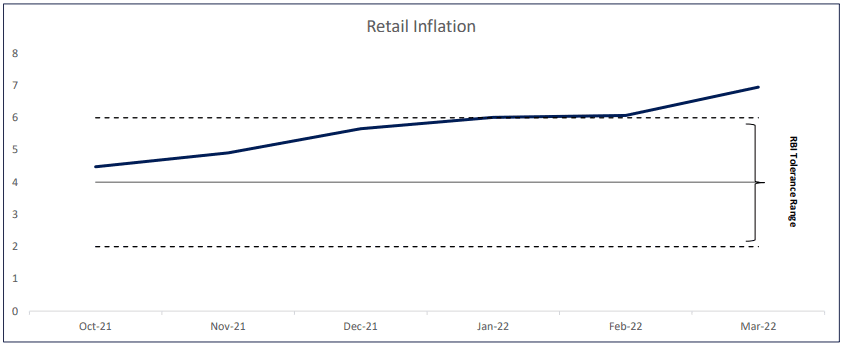
Chart 2: Major central banks have been normalising monetary policies limiting easy liquidity conditions:
TruQuest is knowledge series launched by TruBoard Partners providing succinct updates and views on:
- Liquidity outlook
- India’s macro economic view
- Trends within the infrastructure, Real Estate and Renewable Energy sectors
- Impact analysis of new regulations and policies on lending and capital flow
Authors:
Debopam Chaudhuri, Head of Research and Ratings
Ria Rattanpal, Research Associate
+91-9819239926, dc@truboardpartners.com
Authors:
Debopam Chaudhuri
Head of Research and Ratings
Ria Rattanpal, Research Associate
+91-9819239926
dc@truboardpartners.com
Disclaimer
The data and analysis covered in this report of TruQuest has been compiled by TruBoard VT Pvt Ltd and its associates (TruBoard) based upon information available to the public and sources believed to be reliable. Though utmost care has been taken to ensure its accuracy, no representation or warranty, express or implied is made that it is accurate or complete. TruBoard has reviewed the data, so far as it includes current or historical information which is believed to be reliable, although its accuracy and completeness cannot be guaranteed. Information in certain instances consists of compilations and/or estimates representing TruBoard’s opinion based on statistical procedures, as TruBoard deems appropriate. Sources of information are not always under the control of TruBoard. TruBoard accepts no liability and will not be liable for any loss of damage arising directly or indirectly (including special, incidental, consequential, punitive or exemplary) from use of this data, howsoever arising, and including any loss, damage or expense arising from, but not limited to any defect, error, imperfection, fault, mistake or inaccuracy with this document, its content.