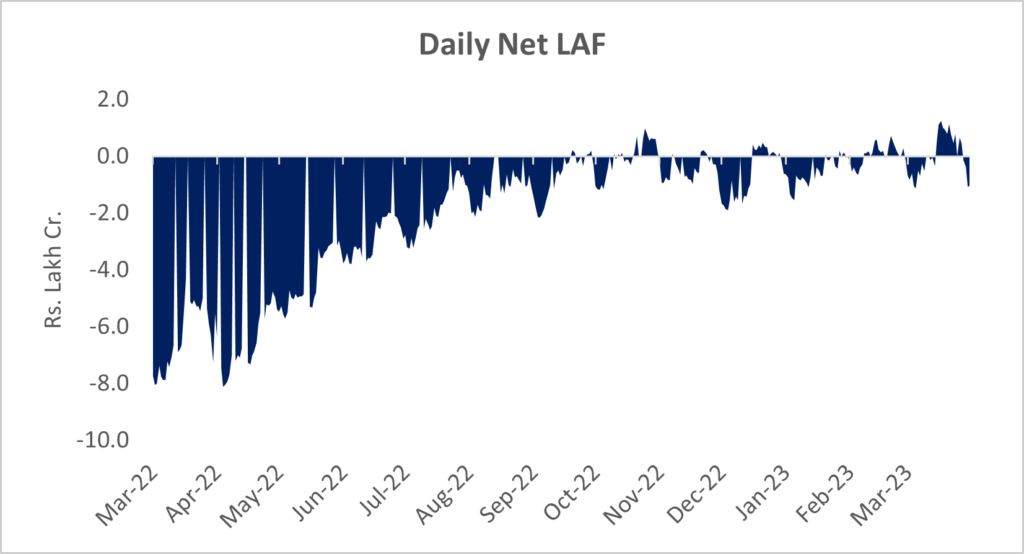
Average daily absorptions under the LAF window was down almost 75% in Mar’23 (Rs. 1,190 crore vs Rs. 4,777 crore in Feb’23). Long term durable liquidity worth ~Rs. 73,000 crore provided under long term repos is scheduled for maturity in March and April 2023.
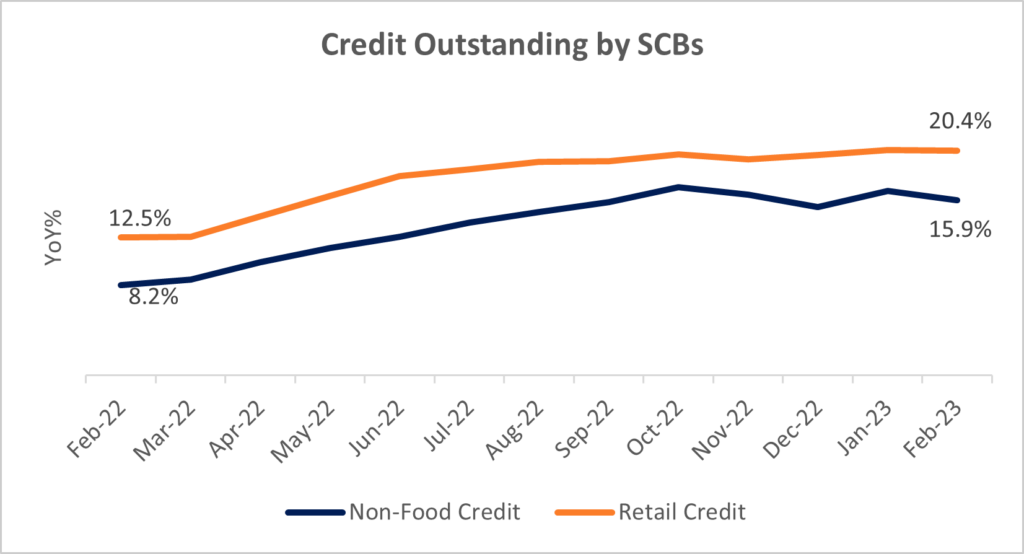
Personal loans witnessed an on-year growth of 20.4% in Feb’23, led by growth in advances against fixed deposits, growing 43% (YoY).
Credit to services sector witnessed double-digit growth of 20.7% in Feb’23, with loans extended to NBFCs growing at the fastest pace of 32.4%.
Source: TruBoard Research, CMIE
Inflation
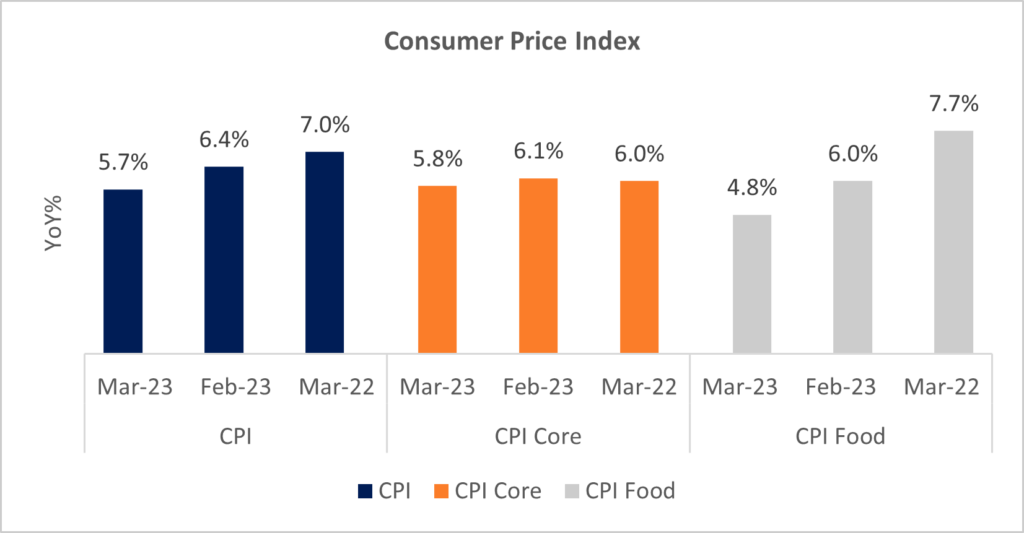
Headline CPI inflation for Mar’23 came in at 5.7% Vs 6.4% in the previous month. For the entire FY23, CPI inflation stands at 6.7%, way above RBI’s upper limit of 6%. Within the food basket, milk, cereals and spices have witnessed high levels of inflation over the major part of FY23.
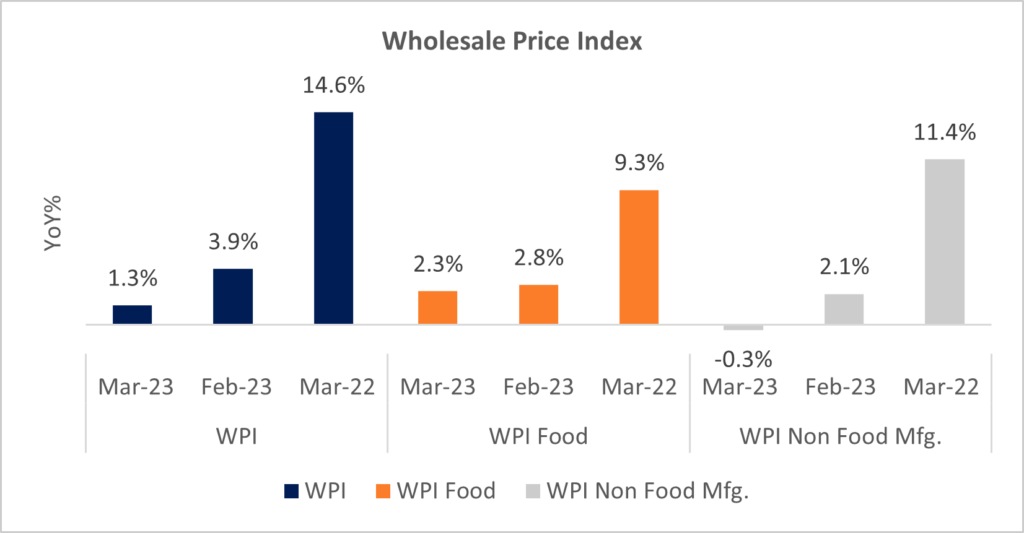
WPI inflation eased to a 29-month low of 1.3% (YoY) in Mar’23, compared to 3.9% (YoY) in Feb’23. Inflation in manufactured products, having ~64% weightage in WPI stood at -0.8% (YoY) in Mar’23 vs a 1.9% (YoY) growth in Feb’23. Easing manufactured food WPI inflation should have a softening impact on CPI food inflation.
Headline CPI inflation is now within RBI’s threshold (the third time in FY23). Sustained fall in WPI inflation should translate into softening CPI as well. However, an increase in global crude oil prices led by the OPEC+ production cut and increased odds of EL-Nino conditions pose a risk to inflation.
Foreign Exchange
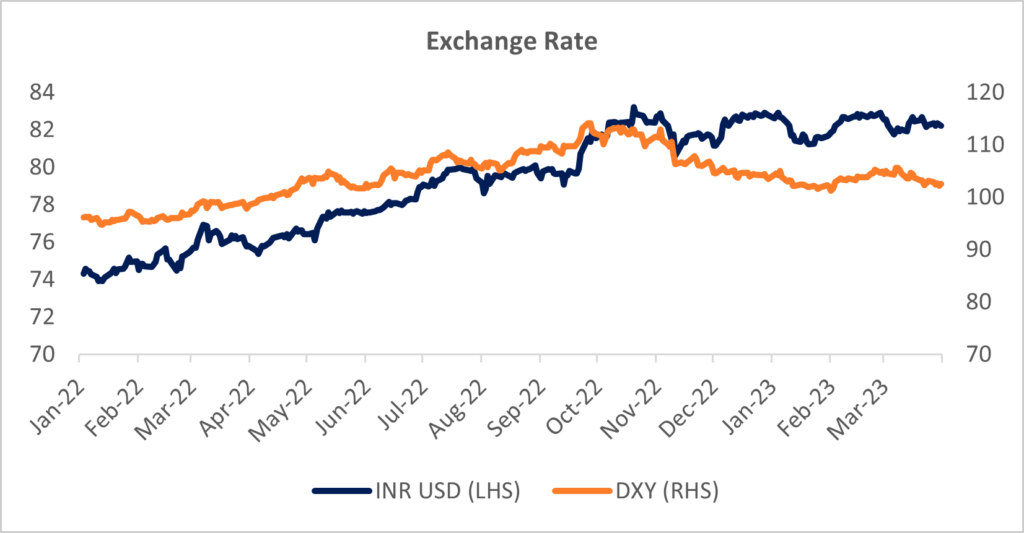
The rupee breached the $80-mark in FY23. The rupee has depreciated by 9% relative to the USD over the course of the fiscal. In Mar’23 however, the rupee appreciated 0.4% on a month-on-month basis. FPI’s, withdrawing USD 501 Bn from the Indian capital markets in Feb’23, turned net buyers in Mar’23, investing USD 711 Bn.
DXY saw some easing in its pace of appreciation, with a month-on-month rise at 0.1% in Mar’23 compared to 0.9% in Feb’23 on account of a softer tone by the US Fed and banking crisis in the US.
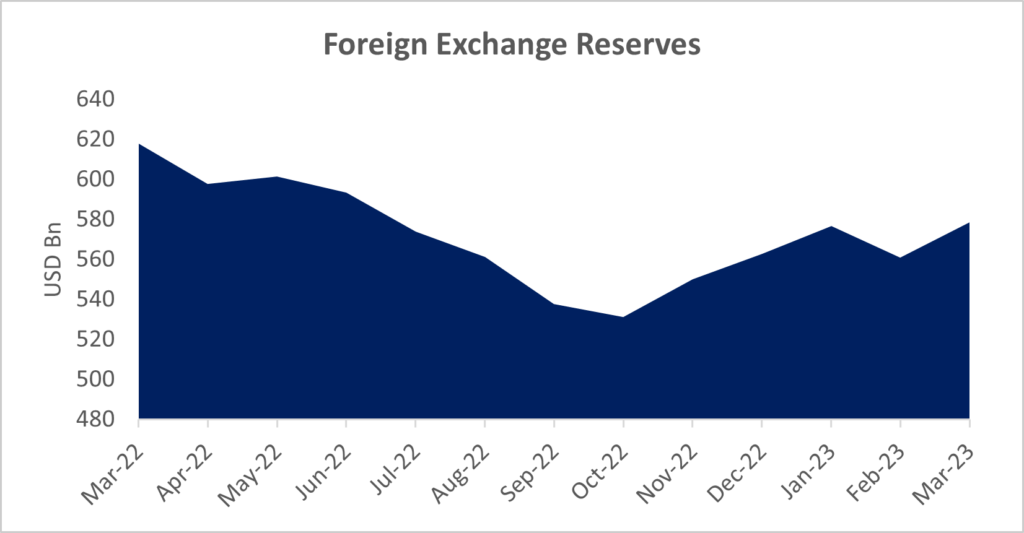
Forex reserves growing USD 17 Bn in Mar’23 (USD 578 Bn in Mar’23 vs USD 561 Bn in Feb’23), return of foreign investors in the Indian markets, and, a slowing pace of appreciation of dollar index are expected to support the rupee in the coming months.
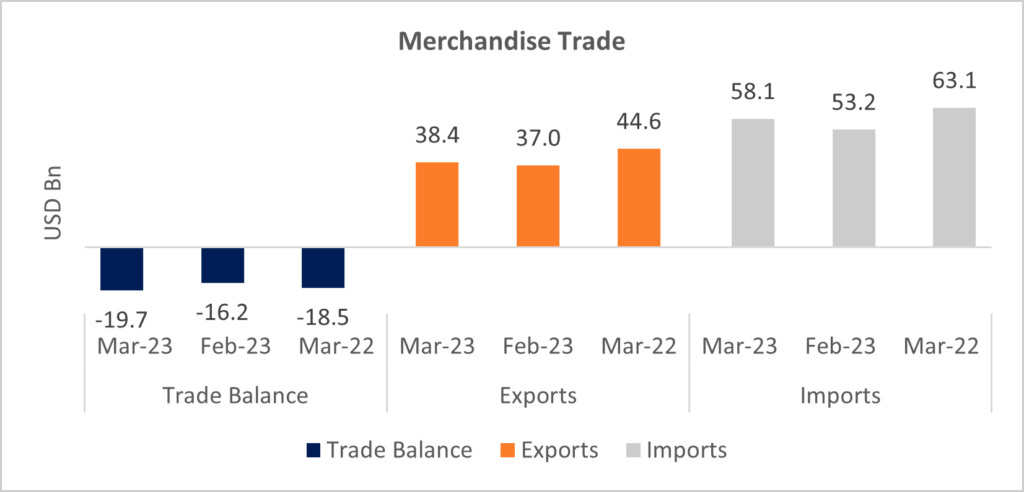
India’s merchandise trade deficit widened to USD 19.7 Bn in Mar’23 led by a contraction in exports by 13.9% (YoY). Imports contracted by 7.9% (YoY) led by a contraction in oil imports (-23.7%). Merchandise exports for FY23 stood at USD 447 Bn, registering a 6% growth. Imports however, swelled by 16.5%, leading the trade deficit to grow by almost 40%.
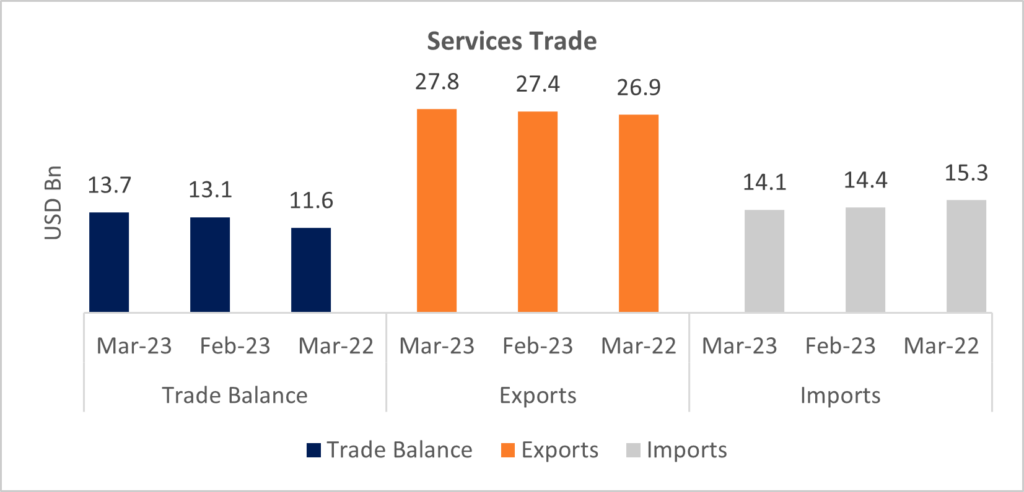
India’s improving services trade surplus, led by exports in computer services, is expected to contribute to improving external sector dynamics. Services exports in FY23 stood at USD 319 Bn, growing by 26%, while surplus on account of trade in services grew by 32%. Improvement in growth outlook of advanced economies by the IMF for 2023 ( 1.3% in Apr’23 vs 1.2% in Jan’23) can further contribute to a rising services trade surplus.
Soft global commodity prices coupled with reduced risks to global growth, and a reduction in risk-off sentiment bode well for India’s exports and current account deficit. The recent rise in global crude oil prices poses a risk to CAD as it in translate into a broader commodity inflation.
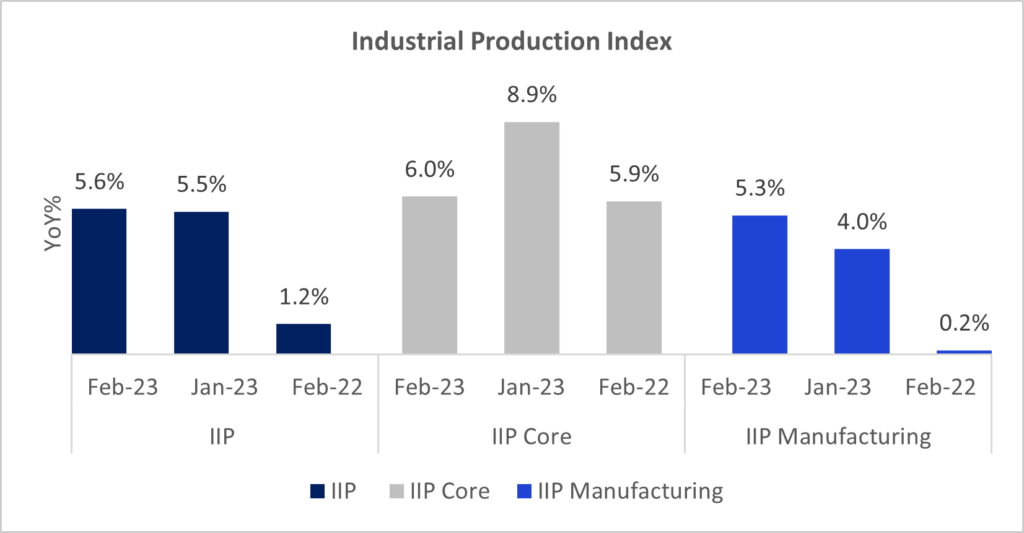
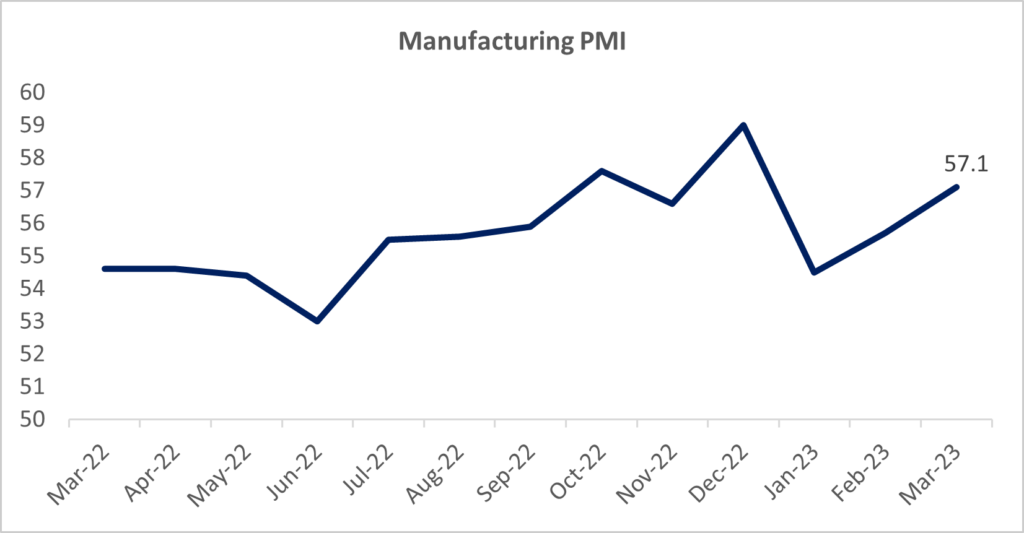
Industrial Activity
Industrial Production grew 5.6% on an on-year basis in Feb’23, owing to a low base in Feb’22. Growth momentum however, decelerated, with a month-on-month decline in IIP by 5.6% in Mar’23.
Manufacturing activity grew 5.3% (YoY). Fastest pace of increase was in pharma, electrical equipment and machinery. However, wearing apparel, electronics and textiles witnessed the sharpest pace of contraction.
According to the infrastructure outlook survey by the RBI, one out of every two infrastructure companies surveyed expect the overall business situation to improve in Q1 FY24. Manufacturing capacity utilization too, improved marginally in Q3 FY23 to 74.3% from 74% in Q2 FY23. This bodes well for industrial output.
Team: Anuj Agarwal, Chief Economist Ria Rattanpal, Research Associate
Team: Anuj Agarwal, Chief Economist Ria Rattanpal, Research Associate
Disclaimer
The data and analysis covered in this report of TruQuest has been compiled by TruBoard Pvt Ltd and its associates (TruBoard) based upon information available to the public and sources believed to be reliable. Though utmost care has been taken to ensure its accuracy, no representation or warranty, express or implied is made that it is accurate or complete. TruBoard has reviewed the data, so far as it includes current or historical information which is believed to be reliable, although its accuracy and completeness cannot be guaranteed. Information in certain instances consists of compilations and/or estimates representing TruBoard’s opinion based on statistical procedures, as TruBoard deems appropriate. Sources of information are not always under the control of TruBoard. TruBoard accepts no liability and will not be liable for any loss of damage arising directly or indirectly (including special, incidental, consequential, punitive or exemplary) from use of this data, howsoever arising, and including any loss, damage or expense arising from, but not limited to any defect, error, imperfection, fault, mistake or inaccuracy with this document, its content.