Realty Watch
Update on Data Trends | September 2022
Global growth outlook
Despite resuming economic activity, global economic outlook for FY23 remains wobbly. International Monetary Fund has been continuously downgrading its 2023 global GDP growth forecast (currently 2.9%) and its worries stemmed mainly from tensions in developed markets like the U.S and China. Some other factors responsible for this downgrade are rising global inflation and the ongoing Russia-Ukraine crisis inflating global energy bills.
Indian economic outlook
Since 2020, India has witnessed two substantial covid waves which took a toll on the public health systems as well as economic growth. While the first wave disrupted growth outlook with manufacturing and services sector activities coming to a halt, the second wave had a cushioned impact owing to localized lockdowns and mass vaccination programs. By Q4 CY’21, business activity started showing early signs of revival and consumer sentiment too was strengthening once again. A renewed optimism towards India’s income and economic outlook started to reflect through higher consumer spending and improving private corporate performance. However, spillovers from global tensions (Russia-Ukraine crisis), emergence of new COVID variants and record high inflation (CPI at 7.8% in April) have made it difficult for the Indian economy to revive. Credit rating agencies ICRA and CRISIL lowered their real GDP growth forecasts for FY23 to 7.2% (from 8%) and 7.3% (from 7.8%) respectively.
The Indian real estate
While headwinds from geopolitical tensions and rising input prices did not have any notable trickle-down impact on the residential real estate demand, rising input costs is pushing developers to raise prices. During the first quarter of FY23, property prices across eight cities in India witnessed appreciation of 5% year-on-year with Delhi NCR, Ahmedabad and Hyderabad witnessing the most significant changes at 10%, 9% and 8% respectively.1
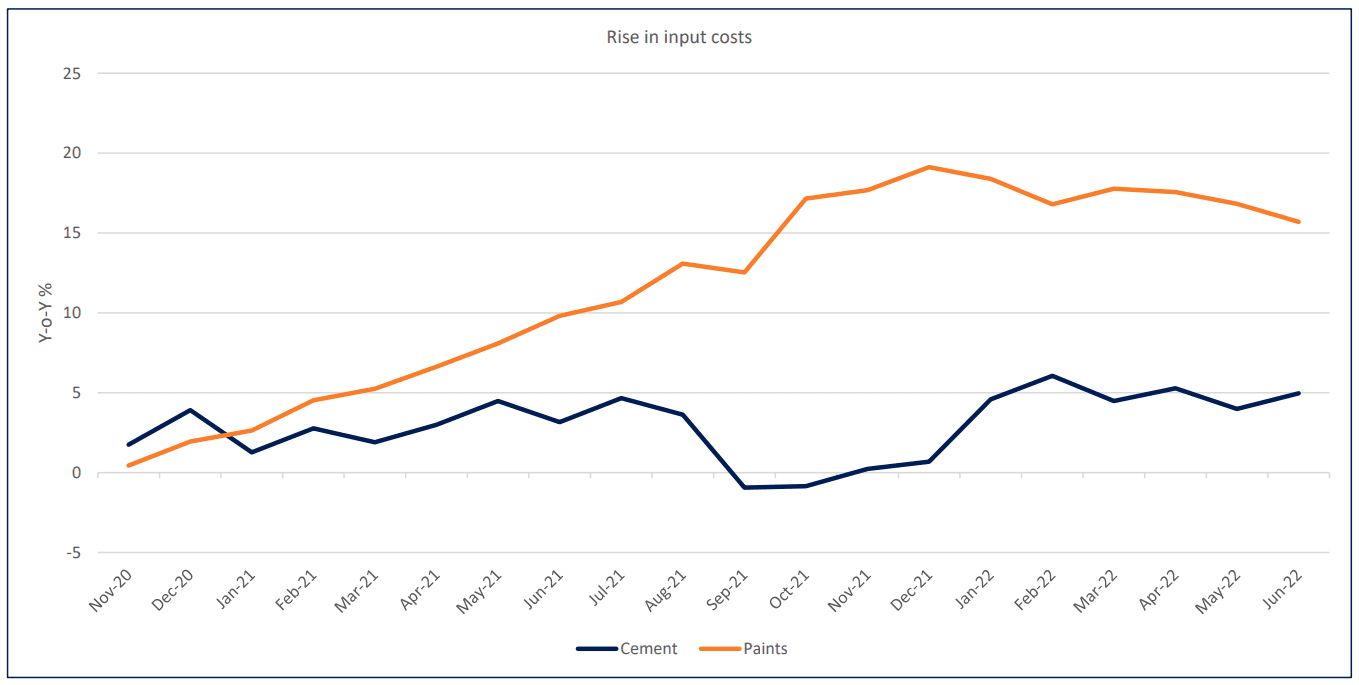
Inflation in India has been extremely high since Jan’22. Inflation based on the Consumer Price Index (CPI), i.e. retail inflation, reached 7.8% in April, the highest since May 2014. Inflationary pressures have affected all major sectors and the real estate sector is no exception. A rise in key raw materials (cement, paints etc) has led the developers to pass on this price rise to end-consumers.
Source: CMIE Economic Outlook
Residential real estate remains strong – no matter what
Despite the rise in property prices and an unfavorable macroeconomic outlook, the real estate sector has displayed considerable strength. This is also visible in the stock market returns generated from Real Estate stocks compared to stocks from other sectors. The chart below plots value of Rs 1 lakhs invested in constituents of BSE Sensex, BSE Realty and BSE Financial Services in Jun’19. The latest levels suggest continued outperformance by realty stocks.
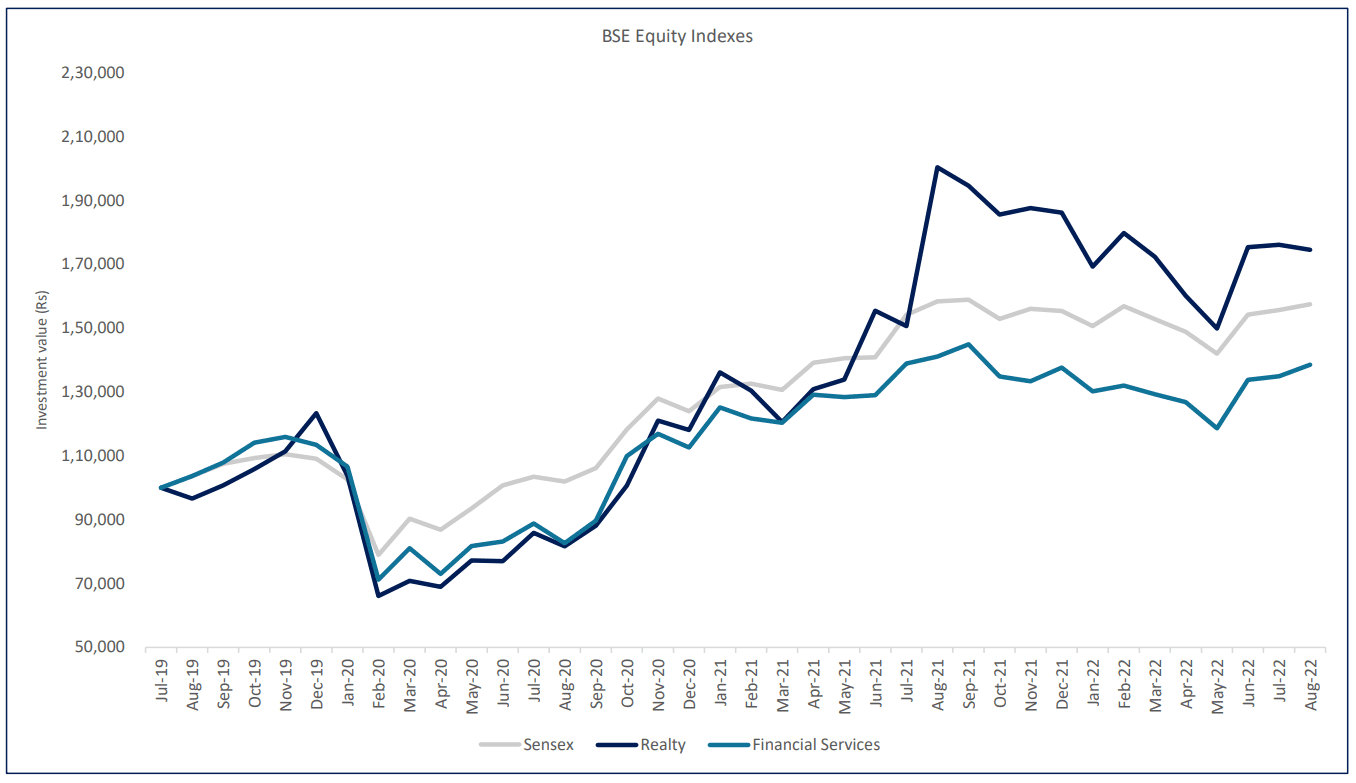
The resilience demonstrated by this sector in the past 2 years can be attributed to the following factors:
1) Strong homeownership sentiment
The Covid19 pandemic induced the need to own a home among consumers, given the sense of safety and security associated with it. That sentiment has stayed strong till now and acts as one of the most important factors helping the sector ride out the storm of uncertainties it faces currently.
2) Developer consolidation
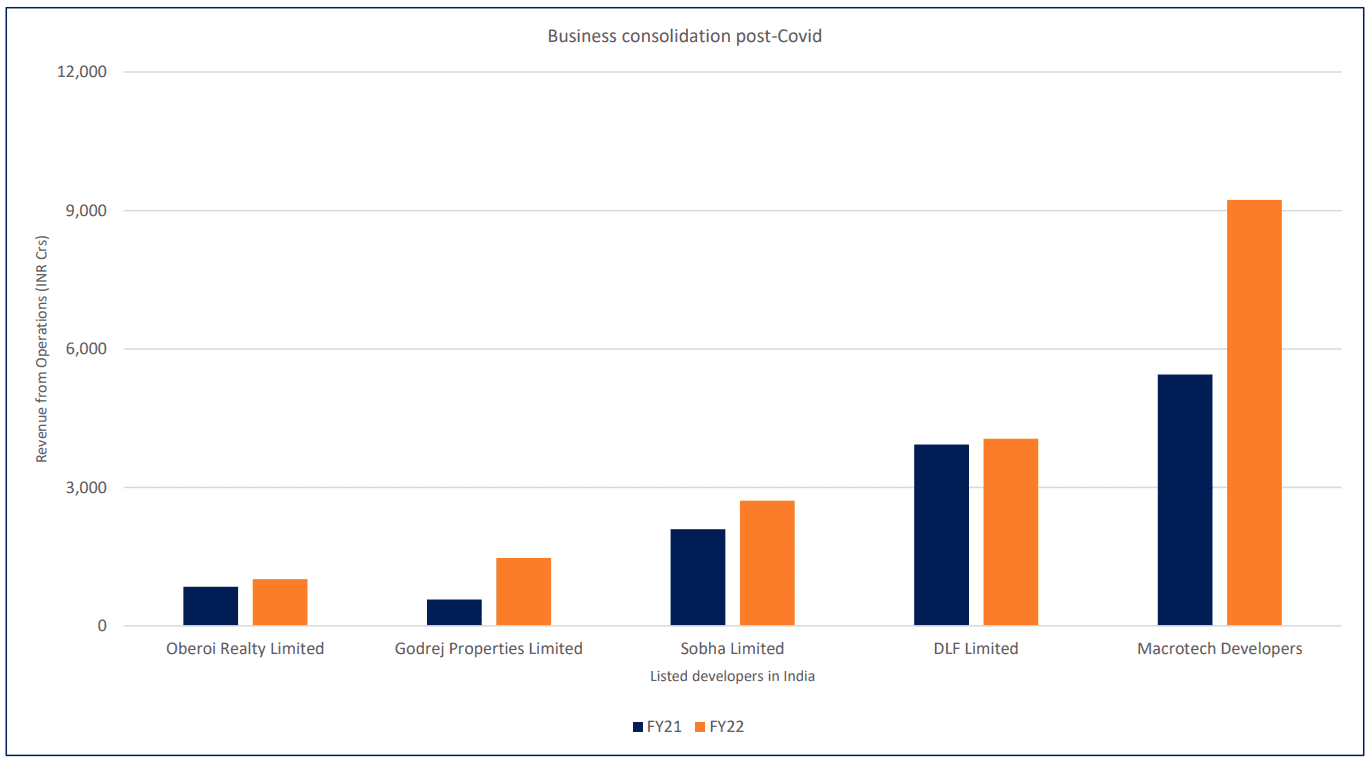
Covid19 has consolidated the real estate market, pushing out small and unorganized players. This has made the market more structurally sound today. Consumers today, depend more on large and listed players to avoid delays during construction and transfer of property. The number of developers launching projects declined to 1,167 in FY20 versus 2800 in FY12, even as the number of units launched per developer increased to 203 units a year versus 166 units in FY17. This reflects improving consolidation despite lower launches. 2
Source: CMIE Economic Outlook
3) Low borrowing costs
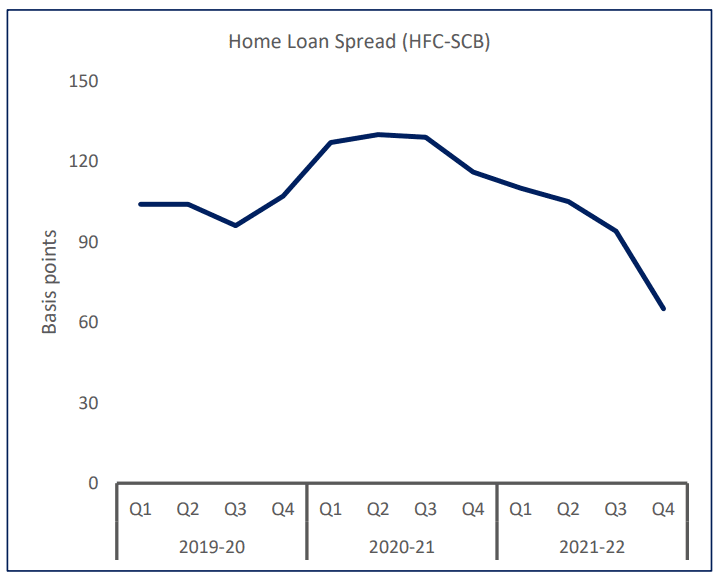
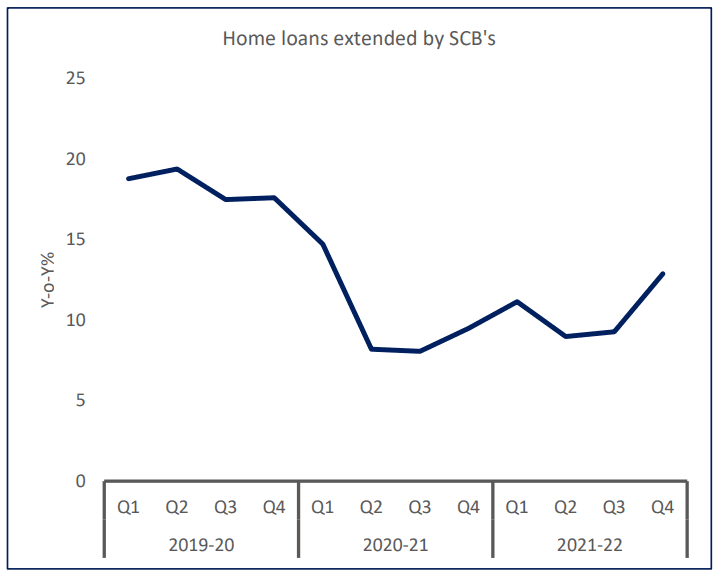
Since FY20, there has been a rise in demand for home loans, owing to historic low repo rates set by the RBI. This, combined with the increased homeownership sentiment increased the demand for home loans among prospective homebuyers. A high demand for home loans coupled with reviving credit flow is increasing the competition among mortgage lenders. The chart below shows the declining spread between home loans extended by Housing Finance Companies (HFC’s) and Scheduled Commercial Banks (SCB’s). The effect of low mortgage rates over the last two years got reflected in the credit disbursed by Scheduled Commercial Banks for housing loans, which witnessed a growth of 12.88 percent year-on-year in Q4FY22 compared to 9.28 percent in the previous quarter.
Source: CMIE Economic Outlook
City-wise trends (Q2 CY’22 vs Q1 CY’22)
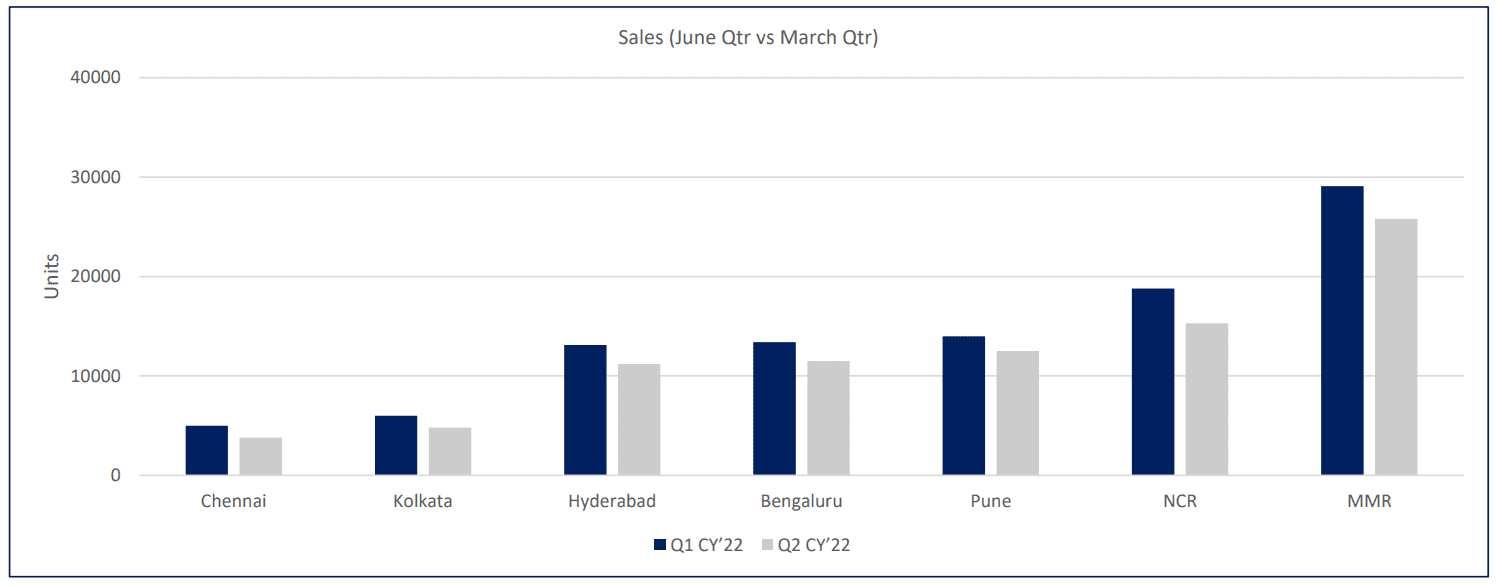
However, the scenario may change with ensuing price rise and hike in borrowing costs. Amidst increasing property prices and three lending rate hikes by the RBI, housing sales moderated in the second quarter of CY’22 across the top 7 metro cities. Housing sales in the second quarter stood at 84,900 units, registering a decline of 15% compared to the previous quarter. MMR remained dominant in terms of housing sales across all metro cities, even as it saw a 11% quarter-on-quarter decline.
Source : Anarock Research
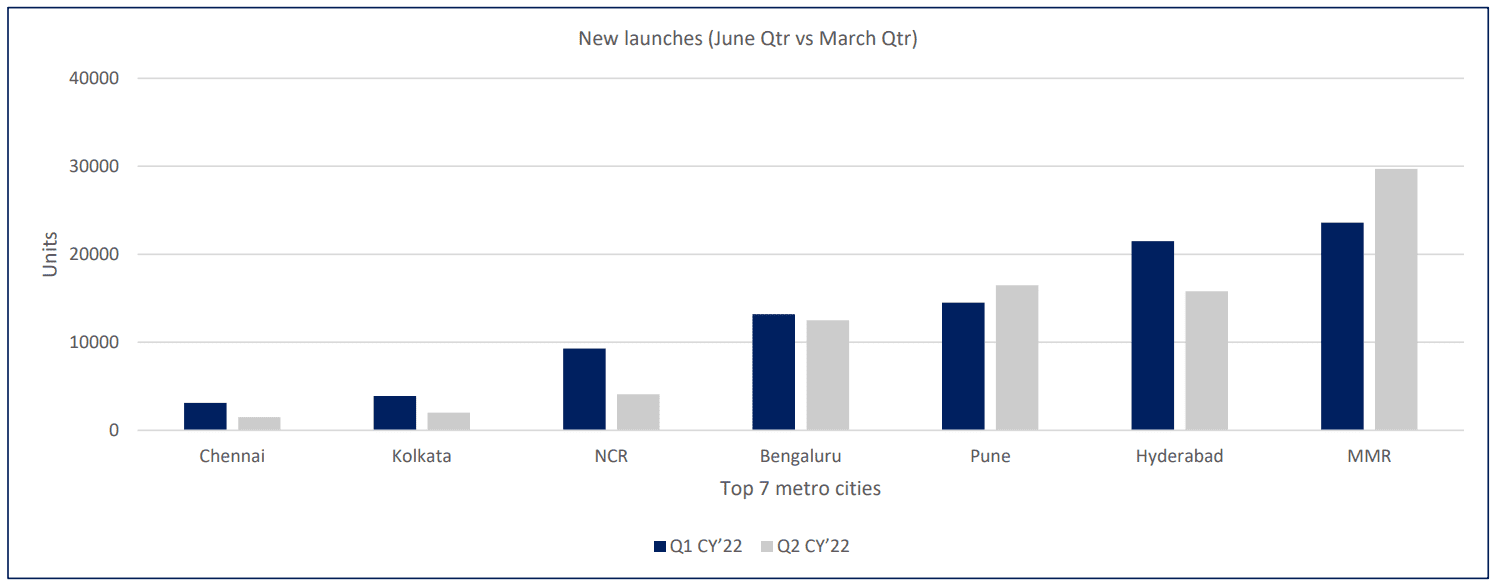
While new launches of housing units registered an overall decline of 8% across all major metro cities,
MMR and Pune were the only two cities that saw a quarter-on-quarter growth of 26% and 14% respectively.
New launches in NCR witnessed the sharpest decline of 56%.
Source : Anarock Research
What’s driving the optimism in MMR
The Government of Maharashtra was the first state government to slash the stamp duty rate from 5% to 2% in CY’20. Low stamp duty rates and repo rates boosted the demand for housing in Mumbai. That demand has stayed unabated ever since, even amidst rising property prices and borrowing rates.
TruBoard Partners, in association with CREDAI-MCHI releases a quarterly House Purchase Sentiment Index which aims to capture purchase plans of prospective homebuyers in Mumbai and map the influencing factors for homebuying. The sentiment index is a weighted average score ranging from 0-100, with a score above 50 considered optimistic and below 50 considered pessimistic. For Q2 CY’22, the overall sentiment index dropped to 65.5 from 72.4 in Q1 CY’22. However, the overall score staying above the threshold of 50 reiterates the undeterred homeownership sentiment among buyers.
This homeownership sentiment is likely to get exacerbated as festive tailwinds, on account of developer discounts, salary bonuses and increments help prospective homebuyers get the best deals.
Key observations across micro markets:
1) While sentiments in the eastern suburbs dropped significantly from 82.3 in Q1 CY’22 to 68.6 in Q2 CY’22, it remained higher when compared to other regions.
2) Demand in Thane, Kalyan and Panvel remained most resilient as it underwent a negligible change in sentiments ( 67.3 in Q1 CY’22 to 67.2 in Q2 CY’22).
Northern and Western regions recorded a marginal decline in sentiments of 5% and 10% respectively.
Outlook
The TruBoard MCHI House Purchase Sentiment Index trends suggest that home buyers are most impacted by their own earning expectations rather than changes in home prices or interest rates. We expect borrowing costs to remain on the rise for the next 3 quarters coupled with higher home prices. But if this is supplemented by robust economic growth, consumer sentiment towards buying homes could remain intact. Public policy backed support to the Indian economy is critical at this stage to ensure sustained economic growth which in turn will ensure better earning potential of end consumers, thereby supporting home demand.
TruBoard Partners is well equipped to effectively monitor changes within the Real Estate sector during this crucial transitory period. The Real Estate business vertical serves as an extended arm for investors in monitoring assets and generating early warning signals with the support of a highly experienced team and a competent technology platform.
TruQuest is knowledge series launched by TruBoard Partners providing succinct updates and views on:
- Liquidity outlook
- India’s macro economic view
- Trends within the infrastructure, Real Estate and Renewable Energy sectors
- Impact analysis of new regulations and policies on lending and capital flow
Team:
Debopam Chaudhuri, Head of Research and Ratings
Ria Rattanpal, Research Associate
Komal Chavan, Marketing Associate
91-9819239926, dc@truboardpartners.com
Team:
Debopam Chaudhuri, Head of Research and Ratings
Ria Rattanpal, Research Associate
Komal Chavan, Marketing Associate
919819239926, dc@truboardpartners.com
Disclaimer
The data and analysis covered in this report of TruQuest has been compiled by TruBoard Pvt Ltd and its associates (TruBoard) based upon information available to the public and sources believed to be reliable. Though utmost care has been taken to ensure its accuracy, no representation or warranty, express or implied is made that it is accurate or complete. TruBoard has reviewed the data, so far as it includes current or historical information which is believed to be reliable, although its accuracy and completeness cannot be guaranteed. Information in certain instances consists of compilations and/or estimates representing TruBoard’s opinion based on statistical procedures, as TruBoard deems appropriate. Sources of information are not always under the control of TruBoard. TruBoard accepts no liability and will not be liable for any loss of damage arising directly or indirectly (including special, incidental, consequential, punitive or exemplary) from use of this data, howsoever arising, and including any loss, damage or expense arising from, but not limited to any defect, error, imperfection, fault, mistake or inaccuracy with this document, its content.
