
Macro Watch
Update on Data Trends | May 2022
Macro Heat Map
A global synchronous drying-up of excess liquidity will dent India inc’s access to capital in coming months. A cyclical upshift in domestic interest rates will add to the woes.
- A sharp spike in global inflation induced major central banks to shift towards tighter monetary policies. Council on Foreign Relations (CFR), a global think tank, captures the extent of tightening and loosening in monetary policies across 54 major countries and ranks it on a scale of -10 (extremely easy) to +10 (extremely tight). The score picked up sharply between Feb’22 to Apr’22 from -9 to +4, illustrating the sudden liquidity withdrawal across the world.
- This pull back in excess liquidity manifested in rapid foreign capital flight and weakening of Emerging Market (EM) currencies, including that of India. Between Jan’22 and Apr’22, Foreign Portfolio Investors pulled out USD ~18 bn (net) from the Indian markets, compared to a net investment of USD 7 bn in 2021.
- Reserve Bank of India’s attempt to stave-off inflation and support USDINR with a 40 bps hike in policy rates (May’22) proved pale in front of severe global geopolitical and macro-economic risks plaguing investors currently. Indian government bond yields and USDINR remain extremely volatile even after rate hike.
- We expect a series of rate hikes in subsequent RBI policy meetings over the next 12 months, restoring the policy Repo rate to the pre covid levels of 6.5% (Jan’19) by the peak of this current rate hike cycle.
- The weakness in USDINR, reasonably higher government borrowing costs and interest payment burden could potentially impact the FY23 budget calculations, inflating India’s fiscal deficit above the targeted 6.4% (of GDP) in FY23. It could also undermine the goal of lowering it to 4.5% by FY26.
- Such slippages may not bode well for India’s credit markets. Elevated interest rates, restricted capital flow and slower economic output can potentially give rise to a new wave of gross nonperforming assets (GNPAs) across retail and wholesale assets.
Industrial Activity
Wholesale and imported inflation is severely impacting capacity utilization across Indian manufacturing sector.
- Manufacturing production (as measured by IIP) grew less than 1% (YoY%) in Q4FY22. Apr’22 is not expected to be any different.
- Private capex remain subdued, and with rising borrowing costs, government sponsored capex investments too are expected to slow down in coming months.
- Manufacturing companies could witness the following headwinds at varying intensities over the next 2-3 quarters:
- Low global and domestic demand as consumption wanes amidst high inflation and interest rates.
- Liquidity tightens and capital costs rise further.
- Energy costs including fossil fuels and electricity remain elevated.
Likely rise in wage inflation of skilled employees.
- Manufacturing production (as measured by IIP) grew less than 1% (YoY%) in Q4FY22. Apr’22 is not expected to be any different.
Private capex remain subdued, and with rising borrowing costs, government sponsored capex investments too are expected to slow down in coming months.
- Manufacturing companies could witness the following headwinds at varying intensities over the next 2-3 quarters:
- Low global and domestic demand as consumption wanes amidst high inflation and interest rates.
- Liquidity tightens and capital costs rise further.
- Energy costs including fossil fuels and electricity remain elevated.
- Likely rise in wage inflation of skilled employees.
Credit Rating Optimism Index
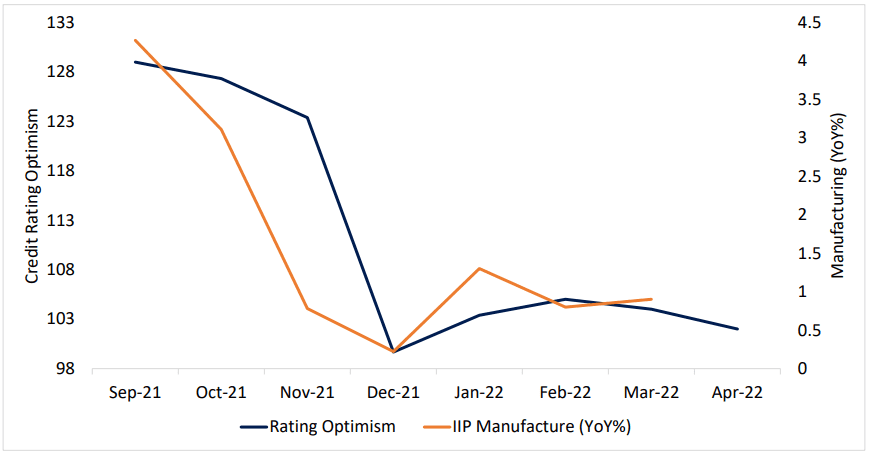
TruBoard Credit Rating Optimism Index’s strong correlation with India’s manufacturing activity makes it an effective early warning signal for manufacturing sector.
- Manufacturing activity (IIP-Manufacture) is mimicking the trend charted by the TruBoard Index. The Index have been predicting slowing manufacturing growth since Feb’22, led by a slowdown across MSME sector. The government indicator is pointing out to the same, albeit with a lag.
- The strong correlation is guided by the fact that the TruBoard Index captures sentiment of rating agencies on MSMEs, which is the driving force behind Indian manufacturing.
TruBoard Macro Forecasts
| Q2 FY23 | Q3 FY23 | FY23 | |
|---|---|---|---|
| Real GDP (%) | 6.5 | 6.3 | 6.7 |
| Retail Inflation (%) | 6.1 | 5.8 | 5.2 |
| Repo Rate (%) | 4.75 | 5.0 | 6.0 |
| 10 Year Gsec (%) | 7.25 | 7.40 | 7.45 |
| USDINR | 76.8 | 76.4 | 75.5 |
| Q2 FY23 | Q3 FY23 | FY23 | |
|---|---|---|---|
| Real GDP (%) | 6.5 | 6.3 | 6.7 |
| Retail Inflation (%) | 6.1 | 5.8 | 5.2 |
| Repo Rate (%) | 4.75 | 5.0 | 6.0 |
| 10 Year Gsec (%) | 7.25 | 7.40 | 7.45 |
| USDINR | 76.8 | 76.4 | 75.5 |
Consensus Forecasts (RBI Panel of Forecasters)
| Q2 FY23 | Q3 FY23 | FY23 | |
|---|---|---|---|
| Real GDP (%) | 6.4 | 5.1 | 7.5 |
| Retail Inflation (%) | 5.9 | 5.4 | 5.5 |
| Repo Rate (%) | 4.25 | 4.5 | 4.5 |
| USDINR | 77.0 | 76.3 | 76.5 |
| Q2 FY23 | Q3 FY23 | FY23 | |
|---|---|---|---|
| Real GDP (%) | 6.4 | 5.1 | 7.5 |
| Retail Inflation (%) | 5.9 | 5.4 | 5.5 |
| Repo Rate (%) | 4.25 | 4.5 | 4.5 |
| USDINR | 77.0 | 76.3 | 76.5 |
Information Product Descriptions:
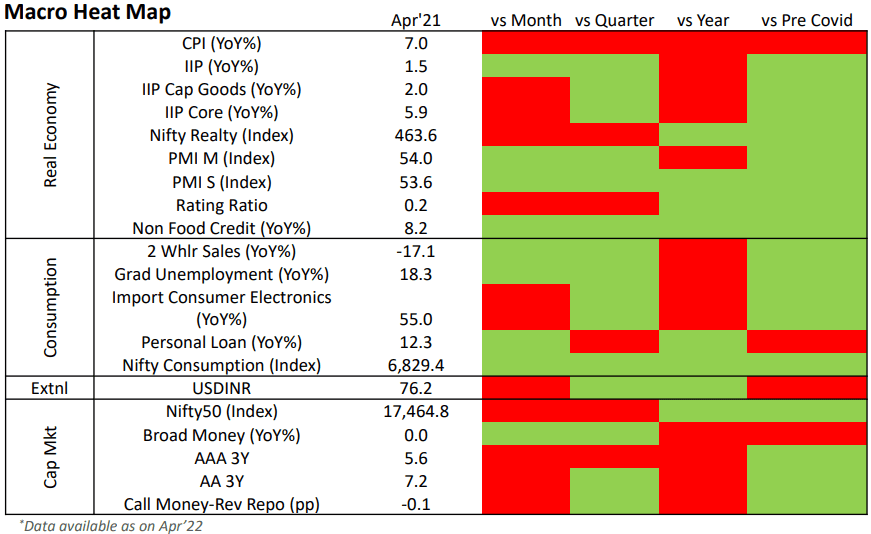
Heat Map: Graphical representation of indicator trends denoted by colour code. Green depicts current reading of an economic indicator is stronger than the previous period (month/quarter/year/2 years). Red signifies the opposite. The economic indicators have been carefully curated to reflect those trends with the highest co-incidental statistical significance on India’s overall economic activity.
Credit Rating Optimism Index: The index reflects the rise or fall in optimism among major credit rating agencies in India. Optimism is denoted by an Optimism score and is calculated as the ratio of Upgrades and Reaffirmations awarded to the total number of entities rated within a specified time period. The optimism score at any point of time is indexed to the score generated in the base period of June 2017 to arrive at the TruBoard Credit Rating Optimism Index. The Base period index level is fixed at 100. Hence any Index level higher than 100 suggests optimism levels in the corresponding period is higher than the base period and vice versa.
Optimism Score = ( Upgrades + Reaffirmations ) / ( Upgrades + Reaffirmations + Downgrades )
TruQuest is knowledge series launched by TruBoard Partners providing succinct updates and views on:
- Liquidity outlook
- India’s macro economic view
- Trends within the infrastructure, Real Estate and Renewable Energy sectors
- Impact analysis of new regulations and policies on lending and capital flow
Author: Debopam Chaudhuri, Head of Research and Ratings
+91-9819239926, dc@truboardpartners.com
Author: Debopam Chaudhuri
Head of Research and Ratings
+91-9819239926
dc@truboardpartners.com
Disclaimer
The data and analysis covered in this report of TruQuest has been compiled by TruBoard Pvt Ltd and its associates (TruBoard) based upon information available to the public and sources believed to be reliable. Though utmost care has been taken to ensure its accuracy, no representation or warranty, express or implied is made that it is accurate or complete. TruBoard has reviewed the data, so far as it includes current or historical information which is believed to be reliable, although its accuracy and completeness cannot be guaranteed. Information in certain instances consists of compilations and/or estimates representing TruBoard’s opinion based on statistical procedures, as TruBoard deems appropriate. Sources of information are not always under the control of TruBoard. TruBoard accepts no liability and will not be liable for any loss of damage arising directly or indirectly (including special, incidental, consequential, punitive or exemplary) from use of this data, howsoever arising, and including any loss, damage or expense arising from, but not limited to any defect, error, imperfection, fault, mistake or inaccuracy with this document, its content.