TruQuest-Logo-Colour

Macro Watch

Update on Data Trends | March 2022

Macro Heat Map

Negative externalities from the Ukraine war will impact price levels and global demand which in turn will delay India’s economic healing process by another 4-6 months.

Macro Heat Map March 2022

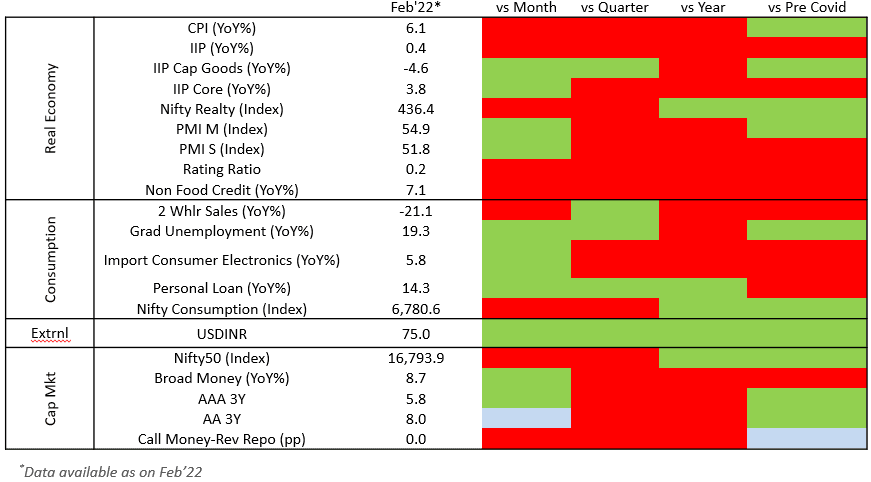
    • Global economy witnessed a synchronous recovery in Feb’22 as Omicron infections subsided and lockdown intensities eased. India was no exception as depicted by the rising greens in the chart above.
    • However, the Ukranian conflict threatens global economic stability driven by collapsing supply chains, rising commodities and agricultural prices and capital flight. We anticipate a weaker heatmap (more reds) in the coming months.
    • In the first 15 days of Mar’22, Indian capital markets witnessed a net outflow of ~USD 6 bn of foreign investments, compared to an outflow of USD 3.8 and USD 5 bn respectively in Jan’22 and Feb’22, thereby weakening USDINR. Recent reports suggest Reserve Bank of India’s interventions amounting to ~USD 10 bn to reduce USDINR’s volatility.
    • Western sanctions on Russian energy exports and the fear of wheat and edible oil shortages is driving inflation globally, including in India. This will have a negative impact on global and local aggregate demand thus adding to the woes of Indian producers and exporters in the short to medium term.
    • Lower export and local demand, coupled with higher raw material prices, wage inflation and higher interest costs can be a threat on the asset quality of lenders, over and above the existing risks.

Source: TruBoard Research, CMIE, Oxford University Lockdown Stringency Index

Industrial Activity

Some of the biggest challenges for Indian manufacturers are high input costs, low domestic demand, high export competition, brimming inventories and high cost of capital. Unfortunately, the Ukraine war can potentially further intensify these headwinds, making it tougher for an uprise of ‘Make in India’ in the short to medium term.

industrial activity march 2022

  • India’s Industrial production grew by a meagre 1.3% in Jan’22 (compared to a year back). One of its components, capital goods, shrunk by 1.4% , suggesting lingering weaknesses in private capex.
  • Despite public policy-based efforts to ensure smooth availability of working capital to a large section of MSMEs, capital expenditure by India Inc remains on the back burner due to skepticism around future demand. High cost of capital is another pull back. The Ukraine war further blurred the visibility on demand revival in near future.
  • We expect continued monetary policy support to ensure undisrupted credit flow to MSMEs despite the growing risks on inflation. In addition, fiscal policy support to public capex needs to be frontloaded in FY23. Also, higher revenue expenditure is desirable to address the dual menace of virus and war on the common Indian masses.

Source: TruBoard Research, CMIE, Oxford University Lockdown Stringency Index

Credit Rating Optimism Index

TruBoard Credit Rating Optimism Index’s strong correlation with India’s manufacturing activity makes it an effective now-caster.

Credit Rating Index march 2022

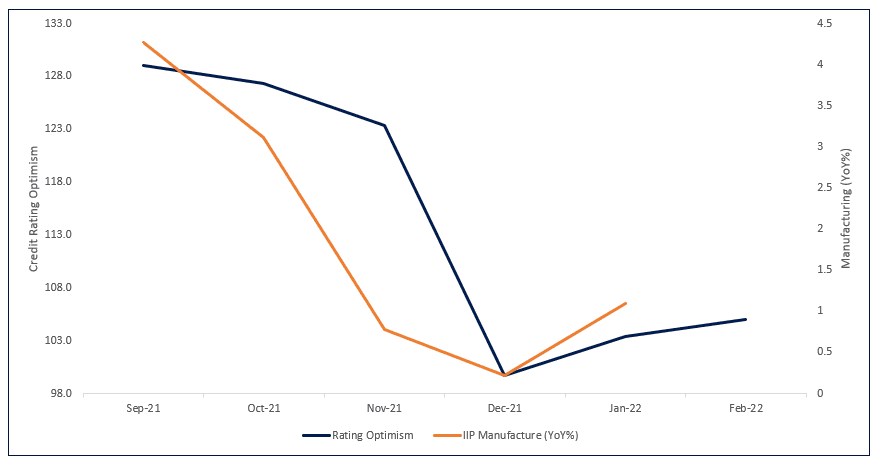
  • Manufacturing activity (IIP-Manufacture) is mimicking the trend charted by the TruBoard Index. The Index had predicted a better manufacturing data for Jan’22 compared to the previous month. The Index now predicts that manufacturing in Feb’22 data is expected to remain positive though with a slight moderation. Early estimates of the Index in Mar’22 suggests a slowdown in manufacturing activity as explained in the commentary above. Government data for Mar’22 manufacturing will be available in May’22.
  • The strong correlation is guided by the fact that the TruBoard Index captures sentiment of rating agencies on MSMEs, which is the driving force behind Indian manufacturing.

Source: TruBoard Research, CMIE, Oxford University Lockdown Stringency Index

TruBoard Macro Forecasts

Q4 FY22Q1 FY23Q3 FY23
Real GDP (%)5.07.06.5
Retail Inflation (%)5.85.75.5
Repo Rate (%)4.04.34.5
10 Year Gsec (%)6.77.07.2
USDINR75.976.275.6
Q4 FY22Q1 FY23Q3 FY23
Real GDP (%)5.07.06.5
Retail Inflation (%)5.85.75.5
Repo Rate (%)4.04.34.5
10 Year Gsec (%)6.77.07.2
USDINR75.976.275.6

Consensus Forecasts (RBI Panel of Forecasters)

Q4 FY22Q1 FY23Q3 FY23
Real GDP (%)5.014.95.5
Retail Inflation (%)5.85.14.7
Repo Rate (%)4.04.34.5
USDINR75.076.576.0

Consensus Forecasts (RBI Panel of Forecasters)

Q4 FY22Q1 FY23Q3 FY23
Real GDP (%)5.014.95.5
Retail Inflation (%)5.85.14.7
Repo Rate (%)4.04.34.5
USDINR75.076.576.0

Information Product Descriptions:

Heat Map: Graphical representation of indicator trends denoted by colour code. Green depicts current reading of an economic indicator is stronger than the previous period (month/quarter/year/2 years). Red signifies the opposite. The economic indicators have been carefully curated to reflect those trends with the highest co-incidental statistical significance on India’s overall economic activity.

Credit Rating Optimism Index: The index reflects the rise or fall in optimism among major credit rating agencies in India. Optimism is denoted by an Optimism score and is calculated as the ratio of Upgrades and Reaffirmations awarded to the total number of entities rated within a specified time period. The optimism score at any point of time is indexed to the score generated in the base period of June 2017 to arrive at the TruBoard Credit Rating Optimism Index. The Base period index level is fixed at 100. Hence any Index level higher than 100 suggests optimism levels in the corresponding period is higher than the base period and vice versa.

Optimism Score = ( Upgrades + Reaffirmations ) / ( Upgrades + Reaffirmations + Downgrades )

Download report as PDF 

TruQuest-Logo-Colour

TruQuest is knowledge series launched by TruBoard Partners providing succinct updates and views on:

  • Liquidity outlook
  • India’s macro economic view
  • Trends within the infrastructure, Real Estate and Renewable Energy sectors
  • Impact analysis of new regulations and policies on lending and capital flow
Reach out to us at research@truboardpartners.com

Author: Debopam Chaudhuri, Head of Research and Ratings
+91-9819239926, dc@truboardpartners.com

Author: Debopam Chaudhuri
Head of Research and Ratings
+91-9819239926
dc@truboardpartners.com

Disclaimer

The data and analysis covered in this report of TruQuest has been compiled by TruBoard VT Pvt Ltd and its associates (TruBoard) based upon information available to the public and sources believed to be reliable. Though utmost care has been taken to ensure its accuracy, no representation or warranty, express or implied is made that it is accurate or complete. TruBoard has reviewed the data, so far as it includes current or historical information which is believed to be reliable, although its accuracy and completeness cannot be guaranteed. Information in certain instances consists of compilations and/or estimates representing TruBoard’s opinion based on statistical procedures, as TruBoard deems appropriate. Sources of information are not always under the control of TruBoard. TruBoard accepts no liability and will not be liable for any loss of damage arising directly or indirectly (including special, incidental, consequential, punitive or exemplary) from use of this data, howsoever arising, and including any loss, damage or expense arising from, but not limited to any defect, error, imperfection, fault, mistake or inaccuracy with this document, its content.