
Macro Watch
Update on Data Trends | June 2022
Macro Heat Map
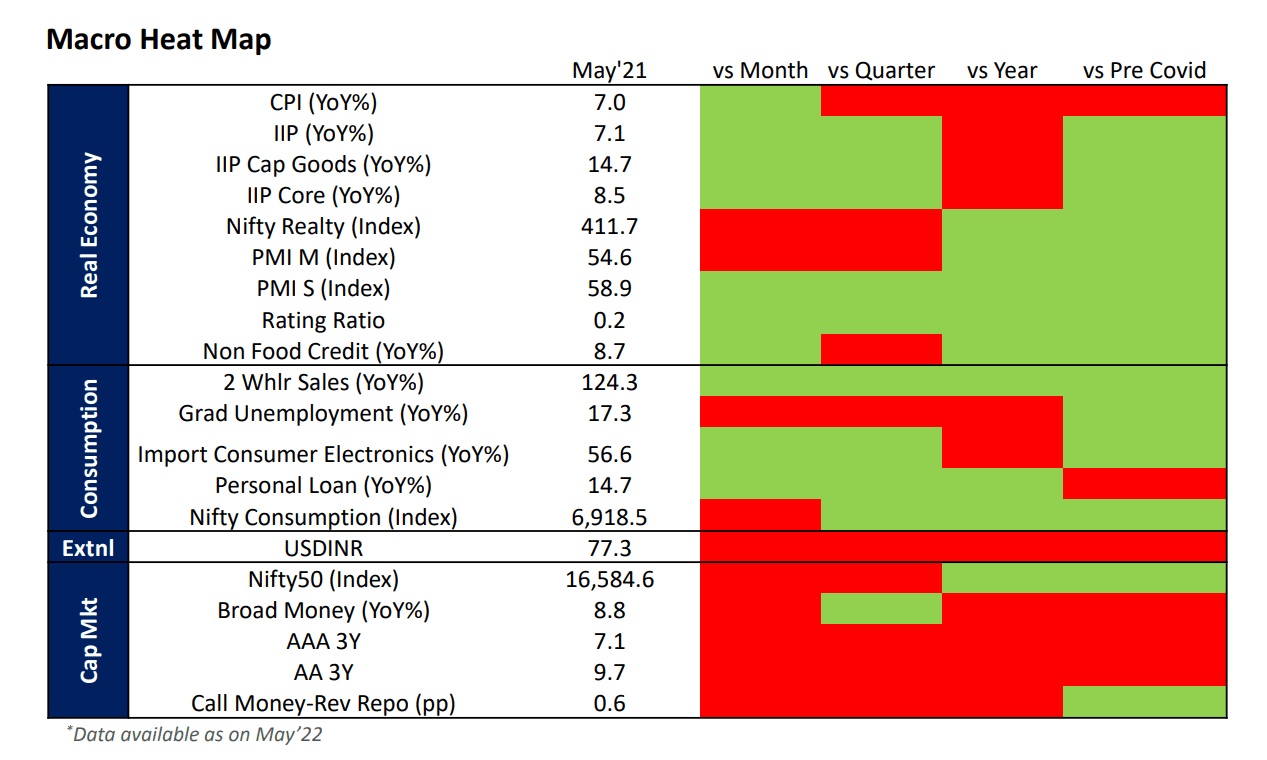
Indian economic growth in FY23 to face the brunt of heavy global inflation and tightening liquidity!
- India’s external sector risks are fast converting into strong headwinds. At USD 23.3 bn in May’22, trade deficit was at record highs. This was due to a weak currency, higher commodity prices and bulging fuel costs. Additionally, export bans to strengthen India’s food security is proving to be a negative externality in managing trade balance.
- A steep outflow of hot money (foreign portfolio investments) is further weakening India’s external balances. A net outflow of ~USD 5bn from across India’s capital markets in May’22 alone resulted in a highly volatile Indian Rupee. Expectations of higher interest rates in USA coupled with heavy risk aversion among foreign investors are prompting this flight to safe-haven, a trend which will stay as major economies dip into a recession.
- Increasing current account deficit (CAD) is taking a toll on RBI’s foreign exchange reserves, depleting it from a high of USD 642 bn in Oct’21 to USD 601 bn by May’22. A rapid depletion in forex reserves is further weighing on the INR weakness, creating a vicious cycle (originating from imported inflation).
- Amidst these risks, RBI’s decision to shift away from accommodative policy is aimed at nipping demand in the economy to control runaway inflation. This is designed to lead to a decline in retail consumption, a key driver of Indian growth (55% of GDP is composed of consumer spending). At the same time, government spending will be limited as revenue collections will be gnawed away by higher subsidies and cuts in fuel excises and private capex will remain weak hindered by high capital costs. All these can culminate in a low aggregate demand scenario in FY23, pulling back India’s GDP growth potential.
- We expect the FY23 GDP to grow by ~6.8%-7% as policy makers try to manage the aforesaid risks.
Industrial Activity
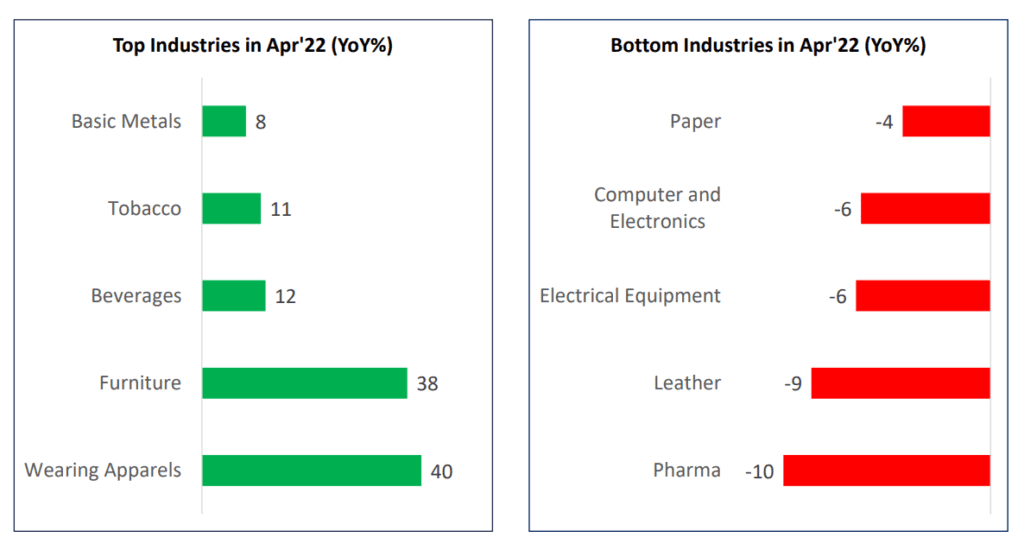
Final consumption goods like furniture, clothes and beverages witnessing a quicker recovery than intermediate goods.
- Higher interest rate environment and removal of excess liquidity may weaken the final goods producing industries as demand slows.
- At the same time intermediate goods producers could undergo more stress as global demand shrinks as well due to an expected recession in those markets.
- Depleting demand, high producer prices, expensive capital and wage inflation will keep margins under pressure in the rest of the year.
Credit Rating Optimism Index
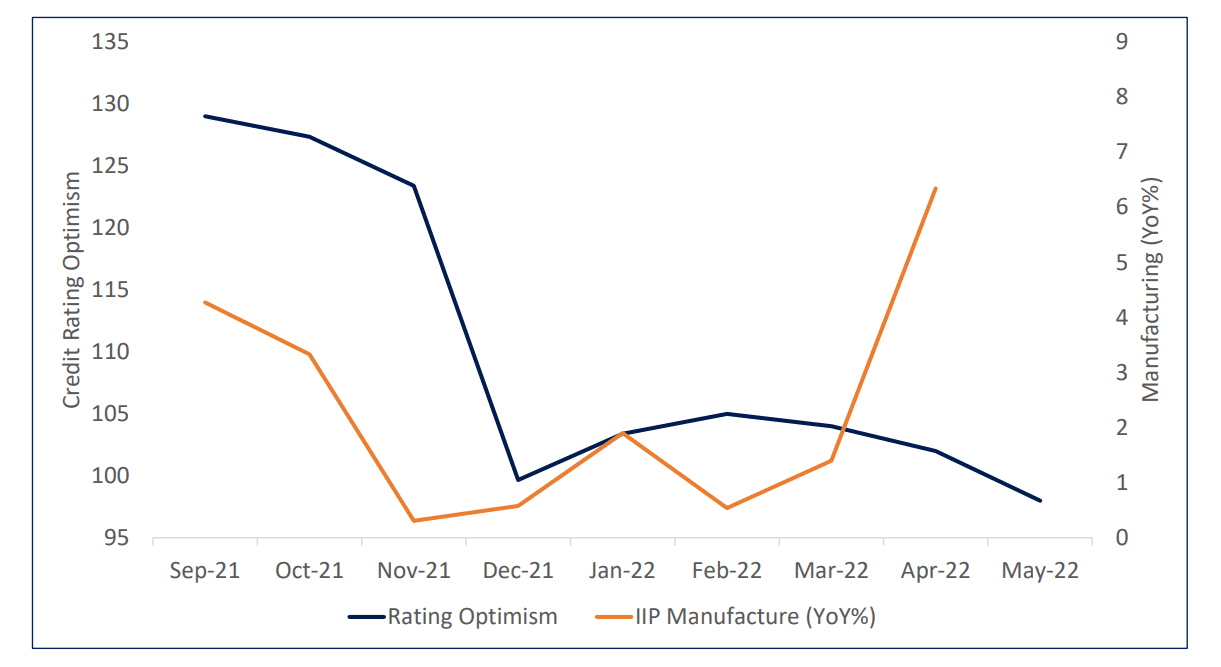
The surprisingly sharp rebound in Manufacturing output in Apr’22 is good news. At 132.5, the absolute IIP Manufacturing level in Apr’22 was the highest since the inception of the Index (new series) in 2011.
- Prevailing weakness within MSMEs remain a major risk to manufacturing growth, as depicted by the Credit Rating Optimism Index.
- Since historically, there has been a strong correlation in the two Indices, it is likely that the sharp recovery in manufacturing in Apr’22 may not be sustained in near future. Factors like rising capital costs and decline in global and domestic demand for manufactured final and intermediate goods could lead to a renewed slowdown.
TruBoard Macro Forecasts
| Q2 FY23 | Q3 FY23 | FY23 | |
|---|---|---|---|
| Real GDP (%) | 6.5 | 6.3 | 6.7 |
| Retail Inflation (%) | 6.6 | 6.1 | 6.2 |
| Repo Rate (%) | 5.5 | 5.75 | 6.0 |
| 10 Year Gsec (%) | 7.6 | 7.6 | 7.5 |
| USDINR | 77.3 | 76.9 | 76.8 |
| Q2 FY23 | Q3 FY23 | FY23 | |
|---|---|---|---|
| Real GDP (%) | 6.5 | 6.3 | 6.7 |
| Retail Inflation (%) | 6.6 | 6.1 | 6.2 |
| Repo Rate (%) | 5.5 | 5.75 | 6.0 |
| 10 Year Gsec (%) | 7.6 | 7.6 | 7.5 |
| USDINR | 77.3 | 76.9 | 76.8 |
Consensus Forecasts (RBI Panel of Forecasters)
| Q2 FY23 | Q3 FY23 | FY23 | |
|---|---|---|---|
| Real GDP (%) | 6.4 | 5.1 | 7.5 |
| Retail Inflation (%) | 5.9 | 5.4 | 5.5 |
| Repo Rate (%) | 4.25 | 4.5 | 4.5 |
| USDINR | 78.0 | 78.0 | 80.5 |
| Q2 FY23 | Q3 FY23 | FY23 | |
|---|---|---|---|
| Real GDP (%) | 6.4 | 5.1 | 7.5 |
| Retail Inflation (%) | 5.9 | 5.4 | 5.5 |
| Repo Rate (%) | 4.25 | 4.5 | 4.5 |
| USDINR | 78.0 | 78.0 | 80.5 |
Information Product Descriptions:
Heat Map: Graphical representation of indicator trends denoted by colour code. Green depicts current reading of an economic indicator is stronger than the previous period (month/quarter/year/2 years). Red signifies the opposite. The economic indicators have been carefully curated to reflect those trends with the highest co-incidental statistical significance on India’s overall economic activity.
Credit Rating Optimism Index: The index reflects the rise or fall in optimism among major credit rating agencies in India. Optimism is denoted by an Optimism score and is calculated as the ratio of Upgrades and Reaffirmations awarded to the total number of entities rated within a specified time period. The optimism score at any point of time is indexed to the score generated in the base period of June 2017 to arrive at the TruBoard Credit Rating Optimism Index. The Base period index level is fixed at 100. Hence any Index level higher than 100 suggests optimism levels in the corresponding period is higher than the base period and vice versa.
Optimism Score= (Upgrades+Reaffirmations)/(Upgrades+Reaffirmations+Downgrades)
TruQuest is knowledge series launched by TruBoard Partners providing succinct updates and views on:
- Liquidity outlook
- India’s macro economic view
- Trends within the infrastructure, Real Estate and Renewable Energy sectors
- Impact analysis of new regulations and policies on lending and capital flow
Author: Debopam Chaudhuri, Head of Research and Ratings
+91-9819239926, dc@truboardpartners.com
Author: Debopam Chaudhuri
Head of Research and Ratings
+91-9819239926
dc@truboardpartners.com
Disclaimer
The data and analysis covered in this report of TruQuest has been compiled by TruBoard Pvt Ltd and its associates (TruBoard) based upon information available to the public and sources believed to be reliable. Though utmost care has been taken to ensure its accuracy, no representation or warranty, express or implied is made that it is accurate or complete. TruBoard has reviewed the data, so far as it includes current or historical information which is believed to be reliable, although its accuracy and completeness cannot be guaranteed. Information in certain instances consists of compilations and/or estimates representing TruBoard’s opinion based on statistical procedures, as TruBoard deems appropriate. Sources of information are not always under the control of TruBoard. TruBoard accepts no liability and will not be liable for any loss of damage arising directly or indirectly (including special, incidental, consequential, punitive or exemplary) from use of this data, howsoever arising, and including any loss, damage or expense arising from, but not limited to any defect, error, imperfection, fault, mistake or inaccuracy with this document, its content.