TruQuest-Logo-Colour

Macro Watch

Update on high frequency macroeconomic data | January 2022

Macro Heat Map

Economic recovery lost momentum between Oct’21-Dec’21

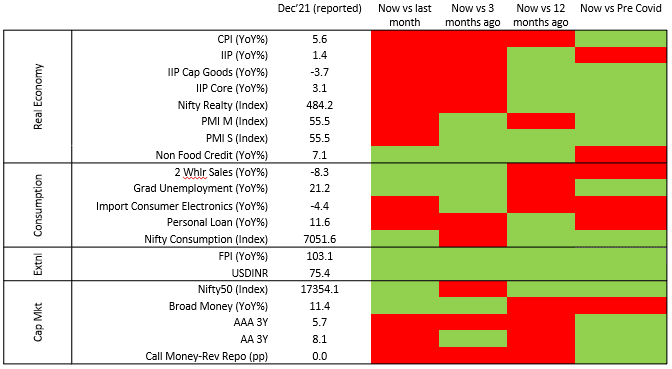
    • The heat-map is skewed towards red, suggesting slipping economic activity in recent times.
    • While economic activity appears better than what it was before the onset of Covid (Dec’19), high frequency macro indicators have been slowing down sequentially since Oct’21. This is in sync with rising lockdown stringency as Omicron wave intensifies with more than 250,000 daily infections reported across the country.
    • Real economy is showing renewed stress with industrial production, capital expenditure as well as construction activity slowing down between Nov-Dec’21.
    • Sticky inflation, rising interest rates and high unemployment levels among graduates is further pushing back a consumption led recovery.
    • Shrinking two-wheeler sales indicate slowing rural spending, at a time when reverse migration (urban to rural) is picking up with agricultural employment rising to 38% from 35% of total employment, over last 3 years.
    • Capital markets are mirroring this stress through rising yields in anticipation of prolonged inflationary pressures. Bank lending remains tepid as private capex fails to pick up. A steady rise in currency in circulation and deposits corroborate weak sentiment towards spending and investments.

Source: TruBoard Research, Centre for Monitoring Indian Economy (CMIE), National Stock Exchange (NSE)

Industrial Activity

Industrial activity expected to remain stressed till Jan’22 as lockdown stringency hovers around 72 (vs 51 in early Dec’21)

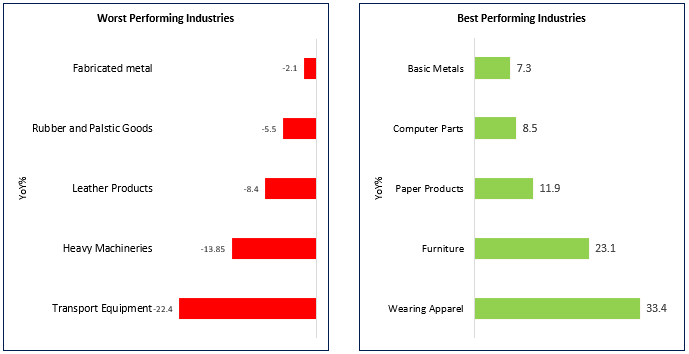
  • Latest industrial production data suggest activity fell to an 8 month low of 1.4%.
  • Prolonged aversion towards capex have led to a sequential decline in production of machineries and equipment as well as finished metal.
  • Global demand however have ensured a steady rise in export industries like textiles and furniture.
  • MSMEs which dominate manufacturing continues to face high stress due to rising inventories, steep raw material costs as well as lower domestic demand. The situation is further exacerbated by rising borrowing costs.
  • More than 40% of investment projects that were stalled in the first 3 quarters of FY22 belonged to the private sector. Number of private projects dropped rose by 18% in FY22 (YTD) compared to same time in FY20.
  • Government support in the form of credit guarantees, cheap liquidity and public capex would be required for a longer period to revive MSMEs which account for 30% of GDP.

Source: TruBoard Research, CMIE, Oxford University Lockdown Stringency Index

Credit Rating Optimism Index

Economic activity expected to regain strength by mid Feb’22

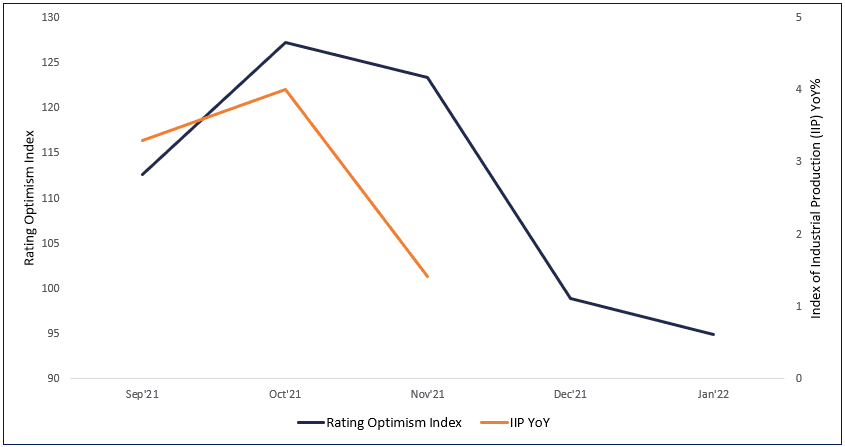
  • The TruBoard Rating Optimism measures the rise or fall in optimism among major rating agencies, compared to a base period (Jun’17). Empirical analysis suggest rating outlook serves as an early warning signal for economic activity.
  • There is a strong causality between the Index (lead) and industrial production levels in India. Based on the decline in rating optimism in recent months, it is unlikely that industrial production levels will witness any major recovery at least till Jan’22 (government estimates will be available in Apr’22).
  • However, as the omicron wave plateaus and starts to subside by end of Jan’22, economic activity is expected to revive once again by early-mid Feb’22, sparking off a renewed bout of growth.

Source: TruBoard Research, CMIE, CRISIL, ICRA

TruBoard Macro Forecasts

3 Months6 Months12 Months
Real GDP (%)5.07.06.5
Retail Inflation (%)5.85.75.5
Repo Rate (%)4.04.34.5
10 Year Gsec (%)6.66.76.7
USDINR75.375.575.5
3M6M12M
Real GDP (%)5.07.06.5
Retail Inflation (%)5.85.75.5
Repo Rate (%)4.04.34.5
10 Year Gsec (%)6.66.76.7
USDINR75.375.575.5

Information Product Descriptions:

Heat Map: Graphical representation of indicator trends denoted by colour code. Green depicts current reading of an economic indicator is stronger than the previous period (month/quarter/year/2 years). Red signifies the opposite. The economic indicators have been carefully curated to reflect those trends with the highest co-incidental statistical significance on India’s overall economic activity.

Credit Rating Optimism Index: The index reflects the rise or fall in optimism among major credit rating agencies in India. Optimism is denoted by an Optimism score and is calculated as the ratio of Upgrades and Reaffirmations awarded to the total number of entities rated within a specified time period. The optimism score at any point of time is indexed to the score generated in the base period of June 2017 to arrive at the TruBoard Credit Rating Optimism Index. The Base period index level is fixed at 100. Hence any Index level higher than 100 suggests optimism levels in the corresponding period is higher than the base period and vice versa.

Optimism Score = ( Upgrades + Reaffirmations ) / ( Upgrades + Reaffirmations + Downgrades )

Download report as PDF 

TruQuest-Logo-Colour

TruQuest is knowledge series launched by TruBoard Partners providing succinct updates and views on:

  • Liquidity outlook
  • India’s macro economic view
  • Trends within the infrastructure, Real Estate and Renewable Energy sectors
  • Impact analysis of new regulations and policies on lending and capital flow
Reach out to us at research@truboardpartners.com

Author: Debopam Chaudhuri, Head of Research and Ratings
+91-9819239926, dc@truboardpartners.com

Author: Debopam Chaudhuri
Head of Research and Ratings
+91-9819239926
dc@truboardpartners.com

Disclaimer

The data and analysis covered in this report of TruQuest has been compiled by TruBoard VT Pvt Ltd and its associates (TruBoard) based upon information available to the public and sources believed to be reliable. Though utmost care has been taken to ensure its accuracy, no representation or warranty, express or implied is made that it is accurate or complete. TruBoard has reviewed the data, so far as it includes current or historical information which is believed to be reliable, although its accuracy and completeness cannot be guaranteed. Information in certain instances consists of compilations and/or estimates representing TruBoard’s opinion based on statistical procedures, as TruBoard deems appropriate. Sources of information are not always under the control of TruBoard. TruBoard accepts no liability and will not be liable for any loss of damage arising directly or indirectly (including special, incidental, consequential, punitive or exemplary) from use of this data, howsoever arising, and including any loss, damage or expense arising from, but not limited to any defect, error, imperfection, fault, mistake or inaccuracy with this document, its content.