
Indian Solar Power
Trends in solar energy | May 2022
Solar Power: India’s lowest cost energy
In the pursuit to make planet Earth a better place to live, there has been a global shift in preference from traditional polluting fossil fuels to renewable sources of energy. The power sector is at the cusp of a revolution, with leaders across the globe embracing these cleaner sources of energy. The recently concluded Glasgow Climate Change Conference in November 2021 witnessed Conference of the Parties (COP 26) agree to all pending items obstructing the implementation of the Paris Agreement on carbon markets (2015). Energy sector is one of the largest Green House Gas (GHG) emitting sectors in India (an active member of COP). Accordingly, during the COP 26 deliberations, PM Modi announced that by 2030, India would increase its non-fossil energy capacity to 500 Giga Watt (GW), which will fulfil 50% of its energy requirements from renewable sources, reduce the carbon intensity of its economy by more than 45%, and reduce total projected carbon emissions by one billion tonnes.
India’s shift in favour of Renewable Energy (RE) had already initiated post the Paris Agreement in 2015. Consequently, the Indian R.E sector has been making steady strides in replacing conventional energy over the last few years. From FY17 to FY22, the installed capacity generation in RE has almost doubled from 57,260 Mega Watt (MW) to 109,885.40 MW. Within this period, the share of renewable energy in the total installed capacity generation rose from 17.0% in FY17 to 27.5% in FY22.
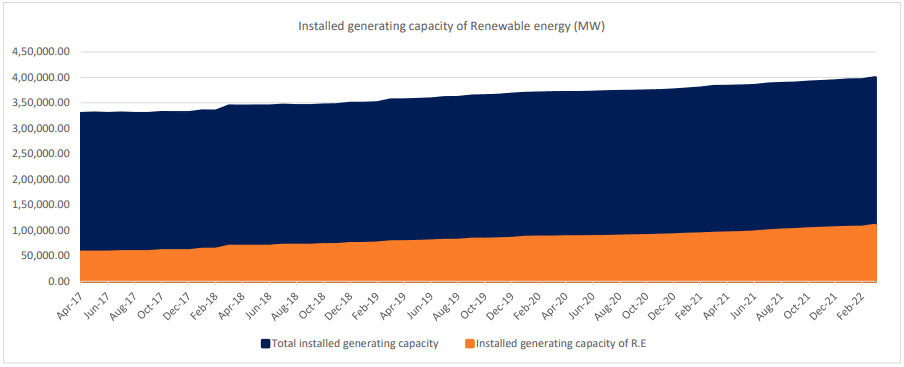
Source : Centre for Monitoring Indian Economy
Solar leads wih 42% share of all renewable power generated in a year, followed by wind at 40% and finally bagasse at 7%, in FY21.
From an annual growth perspective, solar has been steadily outpacing wind and bagasse. While share of wind energy dipped from 50% in FY15 to 40% in FY21, that for Solar energy rose from 11% to 42% during this period.
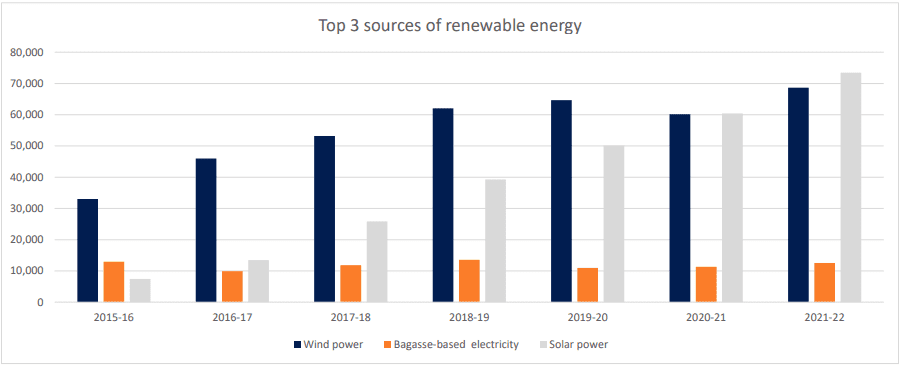
Source : Centre for Monitoring Indian Economy
A multitude of factors have contributed to this stellar rise in solar as a power source over the years.
- Increased participation driving down cost of production
A key factor is the cost advantage of solar generation units. Lower complexities associated with infrastructural requirements compared to other means have attracted higher participation. Larger number of players contributed to a sharp decline in generation costs as economies of scale improved, which in turn attracted more players. Solar power costs successively declined from Rs. 6.17 per unit in FY14 to Rs. 2.44 per unit in FY18.1 This decline was observed globally. Owing to this price decline, a dramatic rise in the deployment of solar projects took place. Prospect of higher energy commodity prices, if sustained, can help drive long-term solar demand based on increased cost competitiveness. For example, coal prices underwent a steep rise since FY18. Australian coal prices grew at a CAGR of 13% from FY18 to FY22. Since majority of India’s coal imports come from Australia (31% of total coal import as on March’22), rising Australian coal prices pose a severe threat to India’s trade deficit, and hence shifting to low cost solar power makes good economic sense.
- Tailwind from better government support
The sector, owing to its economic and environmental viability has been increasingly receiving aggressive government support to grow. This reduces regulatory risks faced by this sector in comparison to some of the other heavily polluting industries. The Government of India aims to augment domestic solar Photovoltaic (PV) cell and module manufacturing and reduce its dependence on imported solar PV cells and modules. In April 2021, Rs. 4,500 crores was allocated as part of Production Linked Incentives (PLI) to boost manufacturing of solar PV modules. The Government is also committed to achieve its ambitious target of 280 GigaWatts (GW) solar PV module manufacturing and reduce its dependence on imported solar PV modules.
In the FY23 budget, an additional Rs 19,500 crores was allocated to facilitate domestic manufacturing for this ambitious goal.
Additionally, the Ministry of New and Renewable Energy (MNRE) is implementing the ‘Development of Solar Parks and Ultra Mega Solar Power Projects’ with a target capacity of 40 GW by March 2024. So far, 50 solar parks have been sanctioned with a total capacity of 33.82 GW in 14 states. Solar power projects of an aggregate capacity of around 9.2 GW have already been commissioned in these parks. Other policy measures included declaration of trajectory for Renewable Purchase Obligation (RPO), waiver for transmission charges and losses for inter-state sale of solar and wind power projects to be commissioned up to June 20252, guidelines for procurement of power through tariff based competitive bidding process and standards for deployment of solar PV systems.
- India’s natural endowment of sunlight
India is a country rich in sunlight and that further strengthens its position as a major contributor to solar energy worldwide. With about 300 clear, sunny days in a year, India’s theoretical solar power reception, on only its land area, is about 5000 Petawatt-hours per year (PWh/yr) (i.e. 5000 trillion kWh/yr or about 600 TW).The daily average solar energy incident over India varies from 4 to 7 kWh/m2 with about 1500–2000 sunshine hours per year (depending upon location), which is far more than current total energy consumption.3 In FY21, India ranked 5th among the top 10 solar producing countries in the world, beating Italy and Australia.4 Solar is also the most secure of all sources since it is abundantly available. A fraction of solar energy that falls on the surface, has the potential to meet the energy requirements of the entire country.
State-wise share
With rising prices of coal, Indian states are actively adopting this shift, aiming to migrate from conventional coal based power to solar power. Leading the way for solar power generation are Karnataka, Rajasthan, Andhra Pradesh, Telangana and Tamil Nadu with a share of 21%, 16%, 13%, 11% and 9% respectively, as on January 2021. Southern states had a higher share in the total solar production in the country in FY21, surpassing Rajasthan (9%) and Madhya Pradesh (7%), which are rich in sunshine.
Challenges
- Import dependence
Mono or poly crystalline Silicon (mono c-Si or poly c-Si), or Passivated Emitter and Rear Cell (mono PERC or poly PERC) ingots and wafers are the key raw materials used for manufacturing of PV cells and modules. Until FY20, about 80% of modules were imported from China due to competitive pricing. However, supply-side pressures due to the pandemic led to a price rise in polysilicon prices, which halted the solar power projects during this period. Poly c-Si and mono PERC PV module prices, increased by 4.0% and 2.4% respectively on a month-on-month basis in FY21.5 The increase however, had limited impact on the percentage of imports. In FY21, over 70% of PVs were imported from Chinese manufacturing firms. To discourage this growing reliance on Chinese imports, MNRE devised a Basic Customs Duty (BCD) in March’21 to augment domestic manufacturing of solar cells. While this is a good move from a long-term perspective, its short-term impact might prove to be quite disruptive. Whether domestic manufacturers can quickly shift to domestically sourced raw materials will depend on additional government support to quickly setup and expand a solar raw material producing industry.
- Funding availability
Limited financing in a capital scarce country like India has always plagued the solar industry. Also, since the operators are primarily small units with low credit ratings, their access to bank capital is also curtailed rendering attractive credit schemes for MSMEs offered by banks or governments of limited use. Laggard funding and high interest rates (>14%) have deterred the MSMEs from installing rooftop solars, a segment with a vast untapped potential for solar power.6
- Land availability
Land in India is a state subject. Developers must seek approvals from various state government agencies (revenue department, state nodal agencies, panchayat etc). JMK Research estimates that about 60-70% of the time is spent on obtaining approvals for land related matters. This stretches the timeline for completion of projects and leads to time and cost overruns. The time taken in general for obtaining approvals for land acquisition is 6-9 months.
Outlook
India’s current RE capacity is little over 100 GW. The Government of India has a target to achieve 500 GW from non-fossil fuels by 2030 for which a detailed plan is yet to be chalked out but there will be a requirement for annual capacity addition of about 50 GW.
Moreover, the rapid pace of globalization nudges the Government of India to take steps towards achieving the UN Sustainable Development Goals. The seventh goal puts emphasis on using affordable and cleaner sources of energy while Goal 13 highlights the need to combat climate change.
In our view, the Russia/Ukraine conflict induced energy crisis will accelerate adoption of renewable energy to reduce external dependencies. Large economies like India and China have laid out plans to adopt to this shift by accelerating solar projects. While near term demand for solar power may not undergo any major shift, however backed by attractive economics and aggressive government support, demand is expected to sharply rise over the next 10 years.
The Intended Nationally Determined Contributions (INDCs) aims to achieve about 40 percent cumulative electric power installed capacity from non-fossil fuel-based energy sources and reduce the emission intensity of its GDP by 33 percent by 2030.
However, the biggest challenge remains access to raw materials. The Ukraine-Russia conflict has further exposed the vulnerabilities in supply chains. Ensuing commodity price rises have been passed on to solar modules impacting revenue projections of solar power generators adversely. A typical solar module is made of an aluminum , PV Glass, Silver, and Polysilicon. In recent times, heavy inflation across all these raw materials have to a great extent wiped off the benefits of the cost reduction progress achieved during the pre-pandemic period, as we had noted earlier. It will take sustained government support and expenditure to help revive the sectoral economics to pre pandemic levels, over the medium term.
Sources:
- IBEF: Case Study: Solar Energy
- https://powermin.gov.in/sites/default/files/Waiver_of_inter_state_transmission_charges_Order_dated_21_June_2021.pdf
- https://journal-index.org/index.php/ijarer/article/view/6824
- Mapped: Solar Power by Country in 2021 (visualcapitalist.com)
- RE Update May 2021 India market solar wind (jmkresearch.com)
- Rooftop Solar Lagging: Why India Will Miss Its 2022 Solar Target – JMK Research & Analytics
TruQuest is knowledge series launched by TruBoard Partners providing succinct updates and views on:
- Liquidity outlook
- India’s macro economic view
- Trends within the infrastructure, Real Estate and Renewable Energy sectors
- Impact analysis of new regulations and policies on lending and capital flow
Authors: Debopam Chaudhuri, Head of Research and Ratings
Ria Rattanpal, Research Associate
Parijat Deshmukh, Vice President
Sudhakar Sundaray, Associate Vice President
+91-9819239926, dc@truboardpartners.com
Authors: Debopam Chaudhuri, Head of Research and Ratings
Ria Rattanpal, Research Associate
Parijat Deshmukh, Vice President
Sudhakar Sundaray, Associate Vice President
+91-9819239926
dc@truboardpartners.com
Disclaimer
The data and analysis covered in this report of TruQuest has been compiled by TruBoard Pvt Ltd and its associates (TruBoard) based upon information available to the public and sources believed to be reliable. Though utmost care has been taken to ensure its accuracy, no representation or warranty, express or implied is made that it is accurate or complete. TruBoard has reviewed the data, so far as it includes current or historical information which is believed to be reliable, although its accuracy and completeness cannot be guaranteed. Information in certain instances consists of compilations and/or estimates representing TruBoard’s opinion based on statistical procedures, as TruBoard deems appropriate. Sources of information are not always under the control of TruBoard. TruBoard accepts no liability and will not be liable for any loss of damage arising directly or indirectly (including special, incidental, consequential, punitive or exemplary) from use of this data, howsoever arising, and including any loss, damage or expense arising from, but not limited to any defect, error, imperfection, fault, mistake or inaccuracy with this document, its content.