A digital wave is transforming global financial services industry by democratizing finance like never before! Fintech has emerged as an important pillar of what is known as the Industrial Revolution 4.0. This digitization, while still at its nascent stage regarding its scale, scope, and complexity, is already challenging orthodox channels of banking and credit management. Technology has made possible new financial products and services that increase the efficiency and convenience of our personal lives.
Global Insights
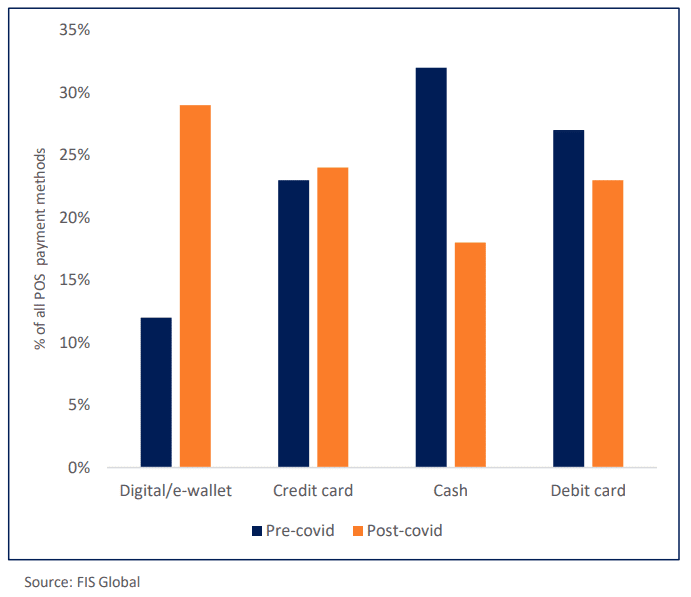
Global financial crisis, need for better financial inclusion through customized and personalized services and Covid-19, catalysed the fintech sector simultaneously across the globe. The last decade witnessed emergence of multiple genres of financial technology entrepreneurs catering to Insurance Technology (InsurTech), Lending Technology (LendingTech), payment services etc. Within these, global payment systems have been an instant hit due to its simplicity and easy adoption by both service providers and end customers. Mobile wallets, peer-to-peer mobile payments and real-time payments are common household terms today, equally popular across all demographic classes with access to internet. In 2017, the global digital payments sector was worth over USD 3000 billion. By 2019, the number rose sharply to more than USD 4,700 billion followed by USD 5,400 billion in 2020 and over USD 6,600 billion in 2021. 1The transition to a digital mode of payment can be seen across industries like BFSI, healthcare, hospitality, e-commerce etc.
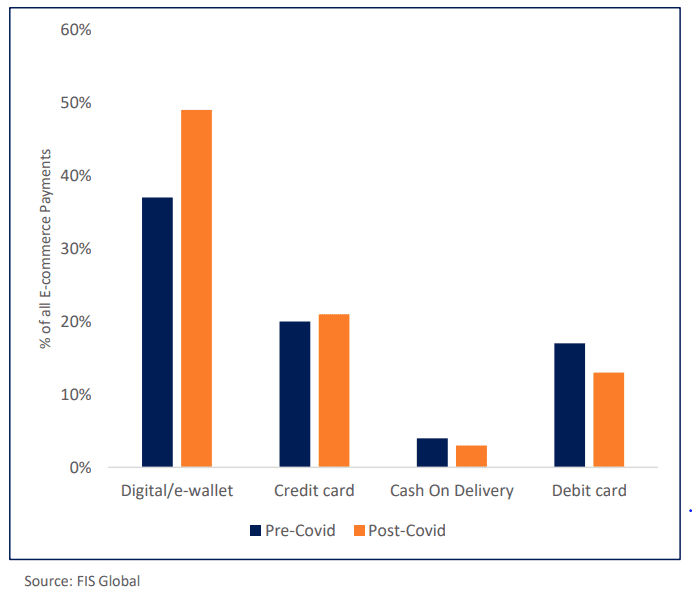
Figure 1: Distinct shift in favor of cashless online payment modes on e-commerce sites as well as in physical stores, pre-covid (2018) vs post-covid (2021), globally.
A plethora of fintech startups have emerged initiating new-age Industry categorisations, which were unheard of across large parts of the world, even 10 years back:
Mobile wallets and Payment apps
Crowdfunding platforms
Cryptocurrency and blockchain technologies
Robo-advisors
Stock trading apps
InsurTech companies
Lending Tech companies
The Indian FinTech landscape
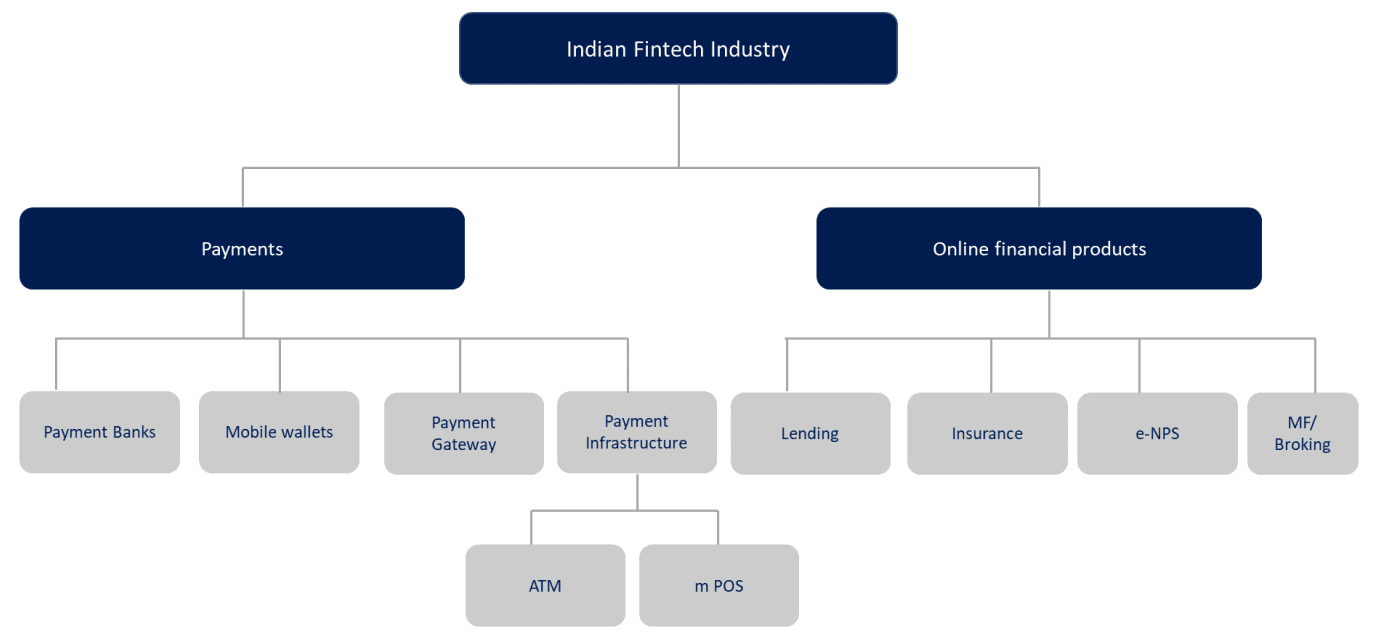
The Reserve Bank of India classifies the Indian FinTech industry as follows:
Figure 2: Classification of India’s FinTech Industry as per RBI working group on FinTech and Digital Banking
India is one of the leaders in germinating the global FinTech revolution. Indigenous products like Immediate Payment Service (IMPS), Unified Payments Interface (UPI), Bharat Interface for Money (BHIM) and Aadhar have been acknowledged across the world as trendsetters in their respective fields. Recent analyst estimates peg the Indian FinTech industry to be valued at USD 150-160 Bn by 2025, from a USD 55 bn valuation across 2,100 FinTech firms, currently. It is estimated that out of 187 global Fintech unicorns, 21 are in India. 2The major enablers of rapid adoption of FinTech in India include the following:
Demonetization and Lockdowns
Steady rise in high-speed internet and mobile penetration across the country.
Acute need for inclusive financial services, as a large part of the population, remains unbanked.
Supportive government and regulatory initiatives. Some of these are programmes like Startup India, Digital India, India Stack, license for payments banks.
Digitisation of financial services have cast an influence not only among India’s private banks, but also the public sector banks which account for more than 60% of banking services in the country. As on March 2022, the value of mobile banking transactions in India was USD 208 billion driven by 250 million active mobile banking customers. Similarly, the value of internet banking was USD 1,114 billion, driven by 75 million active internet banking customers.
Figure 3: Mobile banking transactions over the years in India (USD Bn).
Demonitisation and Lockdowns
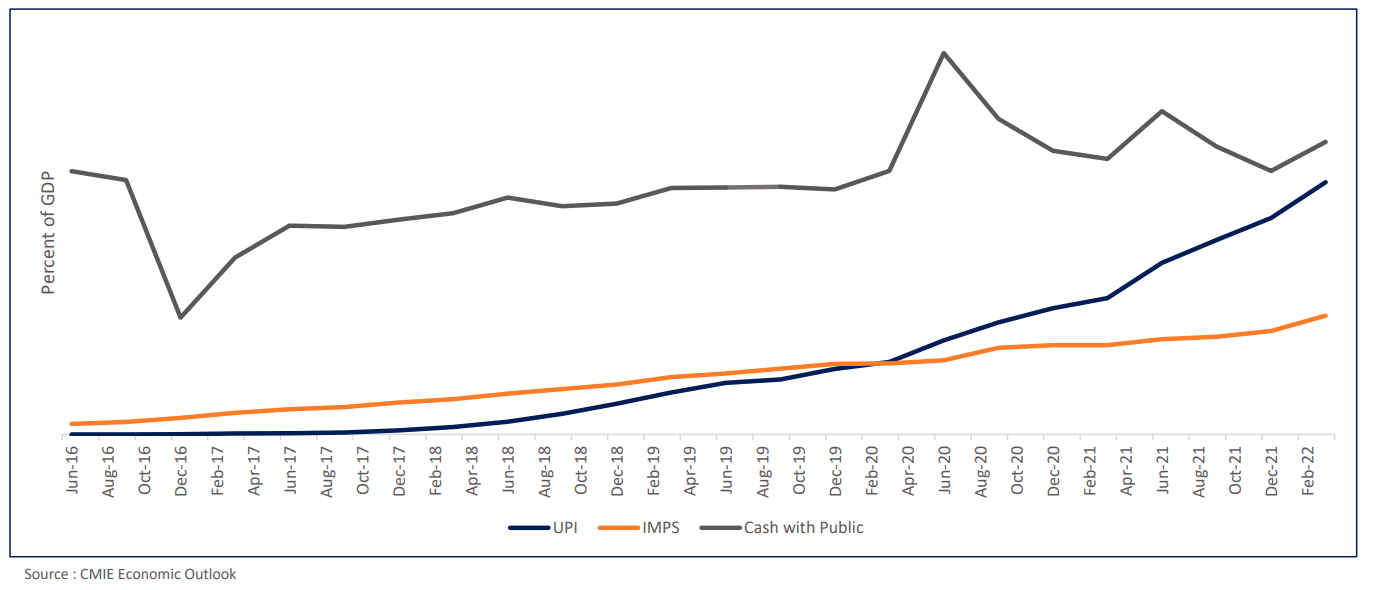
Demonetisation was one of the earliest catalysts that brought India’s FinTech capabilities in the forefront. Indian FinTech has never looked back post the policy-driven payments shock in November 2016, forcing Indians to warm up to cashless transactions deviating from their lifelong affinity towards printed currency. It was not an easy shift, with initially only IMPS payment systems gathering speed, but gradually over 12 months, UPI transactions caught up, and both have been witnessing a sharp growth momentum since then. The next boost came from COVID-19 and the lockdowns in FY21. With surface contact being tabooed and people restricted to homes, there was a renewed zeal towards embracing online methods of transactions.
Figure 4: Rise in UPI and IMPS transactions (% share of corresponding quarter’s GDP)
Increasing mobile and Internet penetration
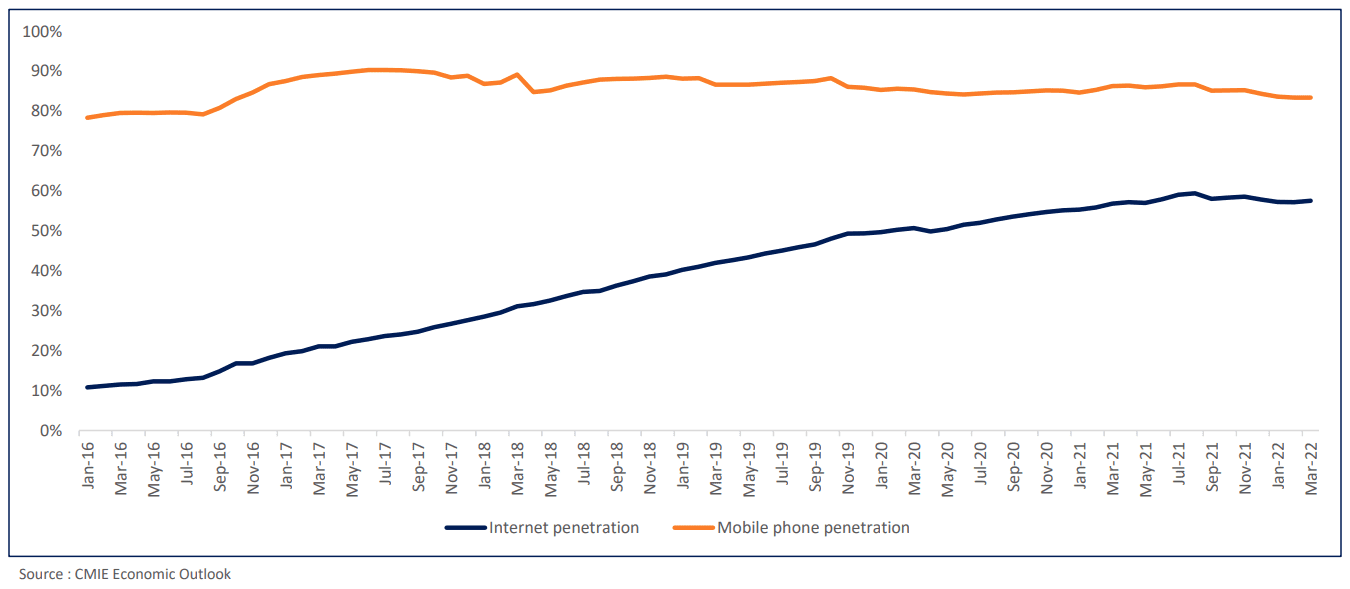
Internet usage is on the rise in India. The number of internet users between January 2016 to January 2022 grew from 14 crores to 78 crores, increasing the share of population with access to the internet to 57% in 2022 from a mere 11% in 2016. With a growing number of populations having access to the internet, the gap between mobile phone usage and internet usage seems to be bridging. A rising internet penetration, especially through mobile phones will enable quicker adoption of digital modes of payments in India
Figure 5: Mobile and Internet penetration in India % (share of population with access)
Need for inclusive financial services:
The objective of Financial Inclusion is to extend financial services to the large un-served population of a country to unlock its growth potential. Empirical studies have indicated that countries with deeper levels of financial inclusion, i.e. access to affordable, appropriate financial services, have stronger GDP growth rates and lower income inequality. World Bank’s Global Findex report suggests that in 2014, 62% of adults globally had a bank account, compared to 53% in India. However, by the subsequent report in 2019, 80% of Indian’s had a bank account. This growth was made possible by government initiatives like the Pradhan Mantri Jan Dhan Yojana (PMJDY) and the advent of FinTechs. However, in absolute terms, this means more than 19 crores Indians still don’t possess a bank account. And if inactive accounts are not included, this number rises manifold.
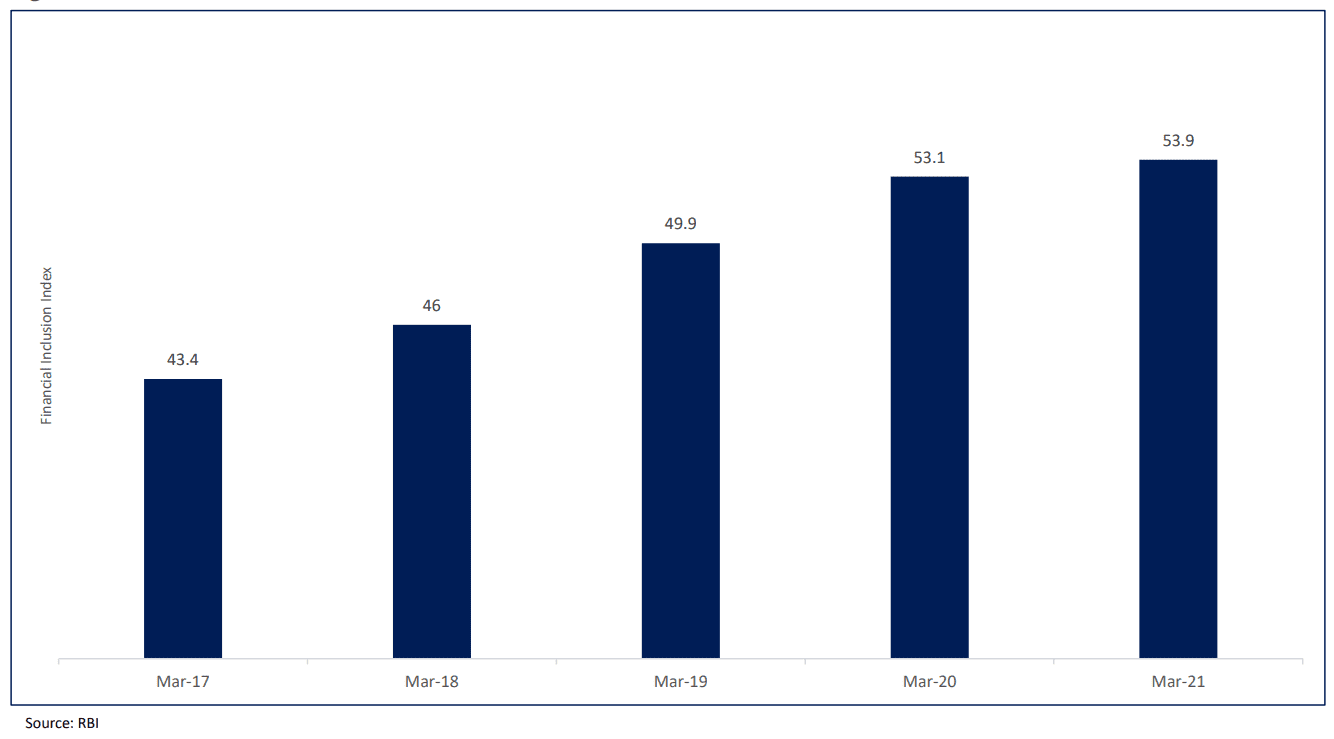
Post demonetization, the financial inclusion index by the Reserve Bank of India, capturing information on various aspects of financial inclusion ranging from 0 to 100, where 0 represents complete financial exclusion and 100 represents full financial inclusion, grew marginally at a CAGR of 5.5% up from 43.4 in 2017 to 53.9 in 2021. Although adequate policy support and growing number of FinTechs have contributed to an increase in digital banking, there still needs to be a collaborative effort from FinTechs, banks and regulatory authorities to ensure access to banking for all.
Figure 6: Financial Inclusion Index, RBI
Policy Support
Realizing the growth potential of digital banking in India, the Reserve Bank of India’s Inter Regulatory Working Group on FinTech and Digital Banking released a report aimed at increasing awareness and adaptation towards FinTech products. Recognizing the pace at which financial technology is overtaking traditional banking, the report also highlighted the need for a regulatory framework to enable the sustained development of a digital financial industry for the future.
Following initiatives were undertaken to achieve the same:
A Payments Infrastructure Development Fund (PIDF) was developed to subsidize deployment of payment acceptance infrastructure in tier 3 to tier 6 centers. This amount was proposed to be increased at the RBI Monetary Policy Meeting in June 2022.
Banks were encouraged to collaborate with FinTechs for better customer experience and operational excellence. Since then, many banks have partnered with FinTechs for expanding their reach and engaging with customers better. During Covid, many banks embraced online banking far more aggressively. Kotak Mahindra Bank- Pine Labs, DBS Bank- CredAble, Axis Bank- BharatPe, Punjab National Bank- Lendingkart were a few of the partnerships that took place in 2021.
Regulatory framework around peer-to-peer lending by recognizing peer-to-peer lenders as Non-Banking Finance Companies (NBFCs).
Measures taken by the Central Government and State Governments
In January 2020, Digital KYC, video-based customer identification process and digital signature on documents was allowed.
Maharashtra Government launched its own FinTech policy in February 2018.
FinTech Investment and Deals (FInD) platform was launched by the Maharashtra Government for matchmaking between startups and investors.
Recent Trends
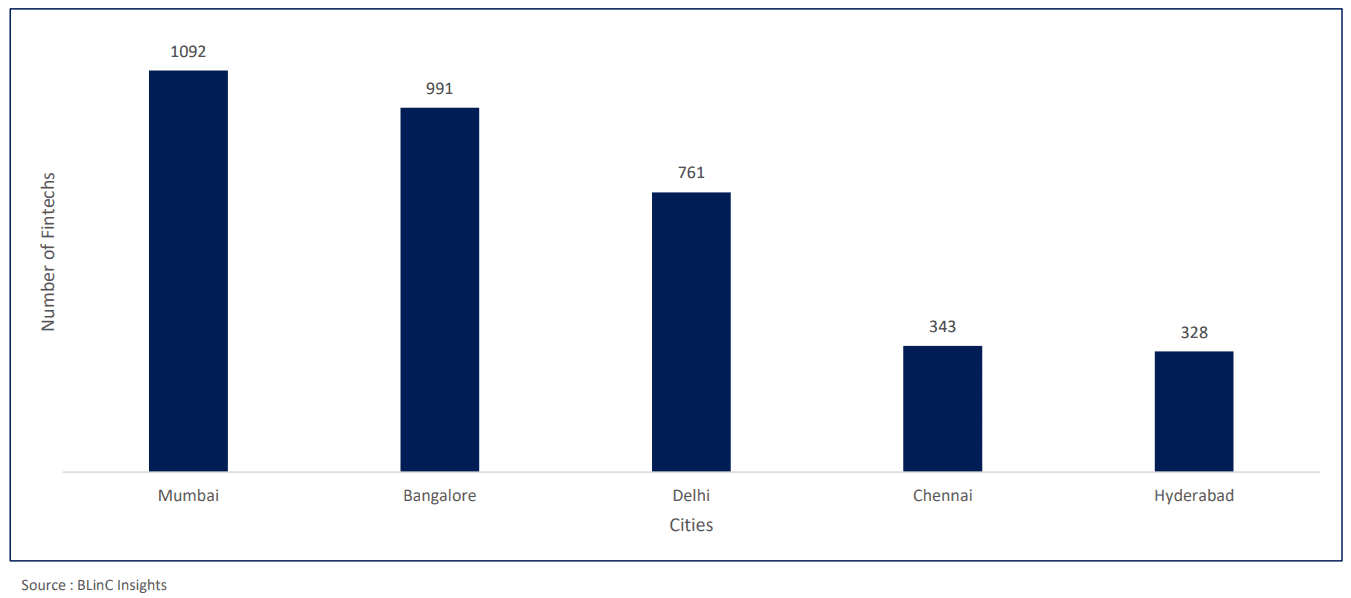
Citywise distribution Mumbai and Bengaluru house the largest number of FinTech companies with 1092 and 991 registered entities respectively, accounting for 59% of all Indian FinTechs, in 2021.
Figure 7: Location of registered FinTechs
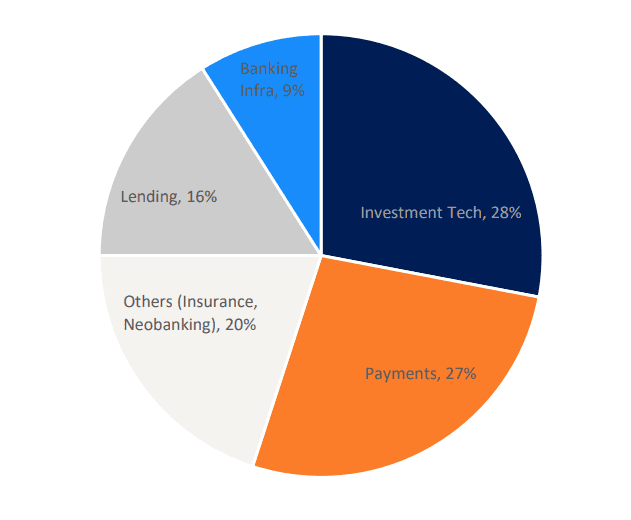
Segment-wise distribution Payments and Securities Broking FinTechs accounted for the highest number of FinTechs, together accounting for 60% of the total FinTechs.
Figure 8: Share of FinTech Types
Source : BLinC Insights
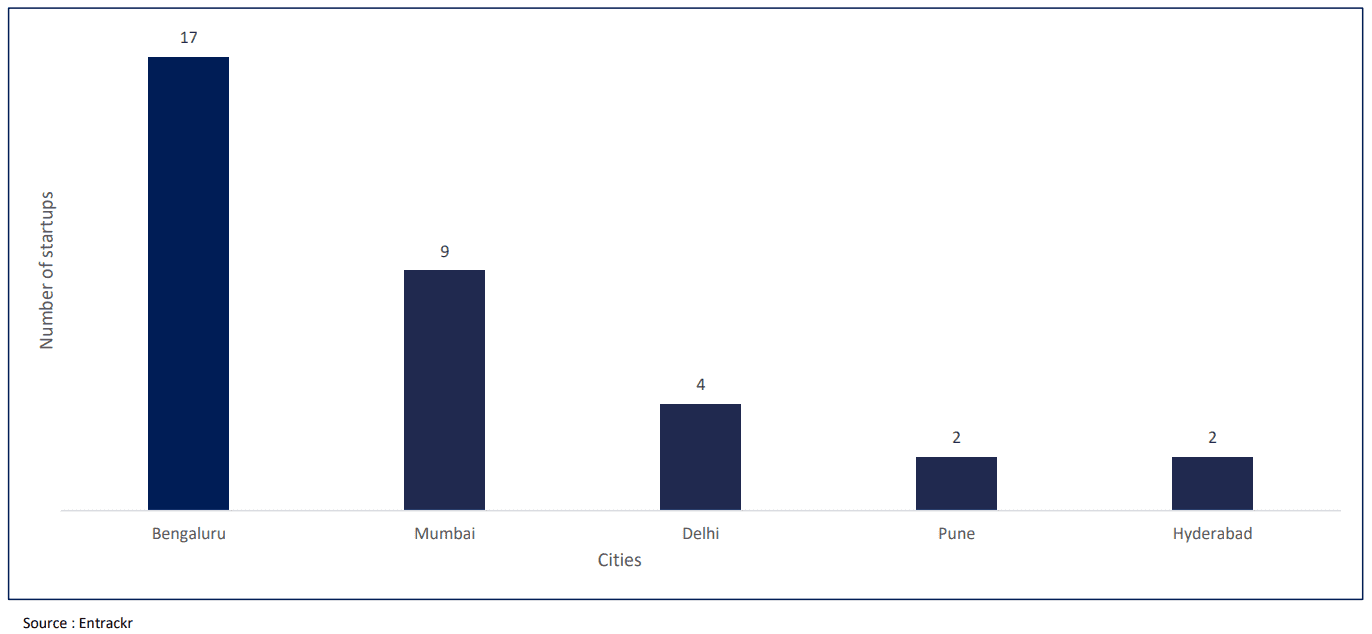
Investor Interest While Mumbai tops the list of total number of FinTechs in the country, Bengaluru is the leader when it comes to incubating new firms. In 2021, the city had the highest number of funded FinTech startups.
Figure 9: Cities attracting funding for FinTech Startups
Number of IPOs The Paytm IPO received 1.66 times subscription from retail investors. However, when listed, it saw a listing discount of 9.3%. 3PB FinTech, the parent company of PolicyBazaar and PaisaBazaar received 3.31 times subscriptions from retail investors and listed with a 17.35% gain.
Table 1: FinTech IPOs in recent times
Company
IPO Size
Segment
Fino Payment
Banks
Rs. 1,200 crores
Payments
PayTM
Rs. 18,300 crores
Payments
PB Fintech (Policybazaar)
Rs. 5,625 crores
Insurance
Source : SEBI
Company
IPO Size
Segment
Fino Payments
Bank
Rs. 1,200 crores
Payments
PayTM
Rs. 18,300 crores
Payments
PB Fintech (Policybazaar)
Rs. 5,625 crores
Insurance
Source : SEBI
Top funded startups While FinTech startups like PolicyBazaar and Paytm had been there before 2016, post demonetization, a multitude of payments-based startups were incorporated. The year 2021, saw a wave of startups across the country. Following are a few of the top-funded IPOs within the country: Table 2: Recent funding trends in some FinTechs
Startup
Segment
Amount($MN)
Pine labs
Payments
700
Acko
Insurance
255
Groww
Broking
251
KreditBee
Lending
145
Source : Entrackr
Startup
Segment
Amount($MN)
Pine labs
Payments
700
Acko
Insurance
255
Groww
Broking
251
KreditBee
Lending
145
Source : Entrackr
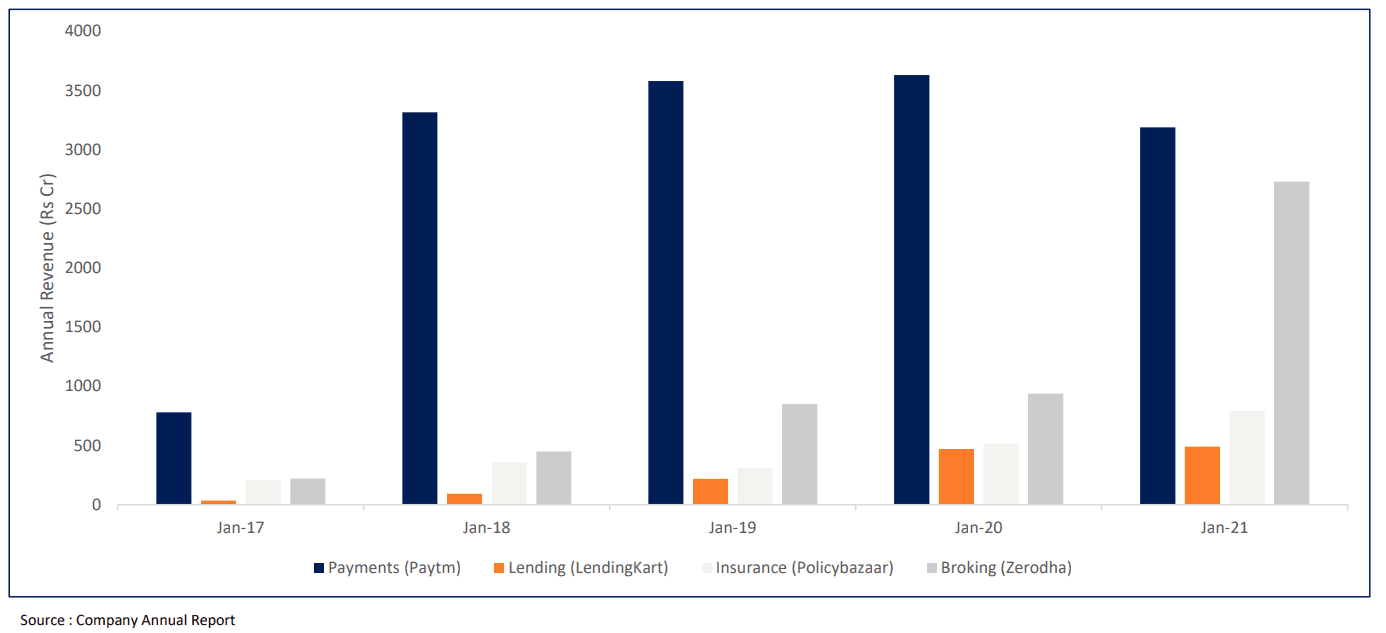
Figure 10: Revenue trends in major FinTechs (Rs Cr)
Outlook
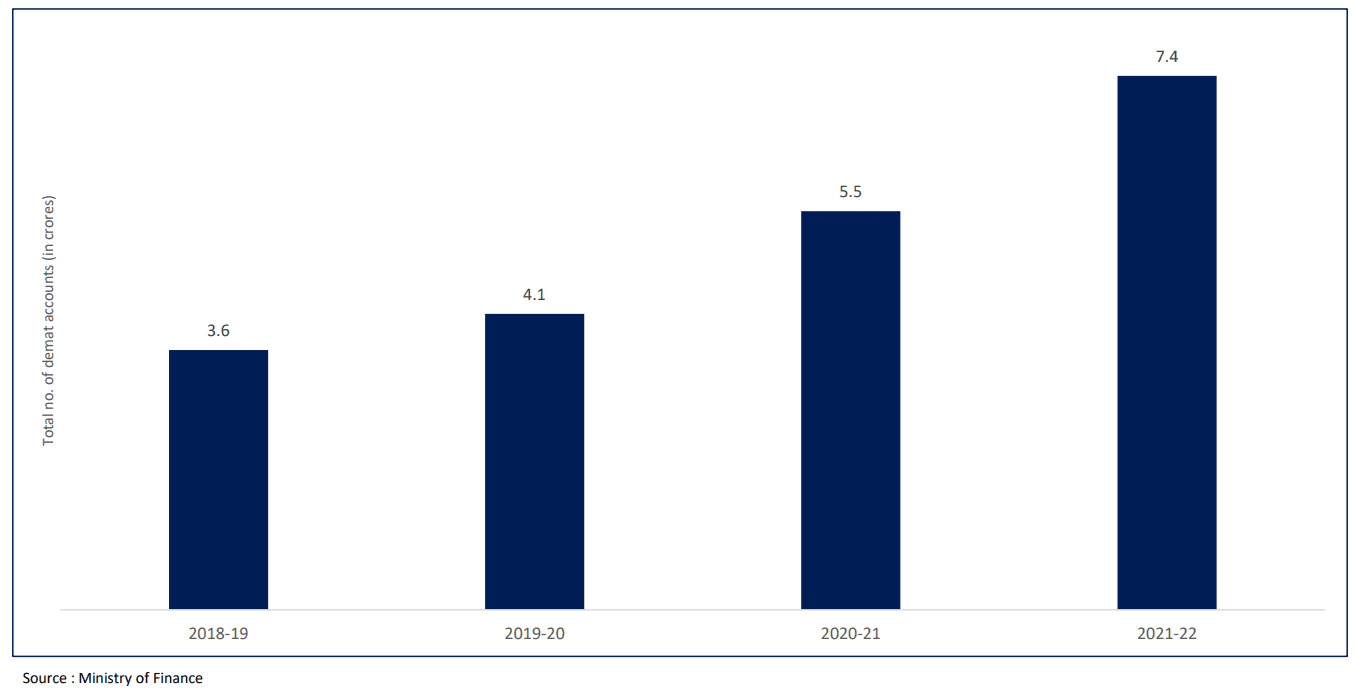
As the financial services industry evolves from traditional banking to a more customer-centric approach offering tailor-made products, FinTech is expected to grow with payments sector leading the way. India’s rich demographic dividend coupled with low financial inclusion offers a unique opportunity for technology-based financial services to cater to the demand of a large young and maturing population. For example, there has been a sharp rise in demat accounts over last few years with many new account holders trading online. In FY21, the number of demat accounts in India stood at 7.38 crores. From 3.59 crores in 2018-19, the number of demat account holders has more than doubled. However, the number of registered investment advisors in the country have not kept pace with this rise. In FY21, the ratio of mutual fund investors and demat account holders to the registered investment advisors stood around 76,510 : 1. This means that for every individual investment advisor, there are 76,510 investors. This gap between MF investors and investment advisors is being bridged by Invest-Techs, that are combining investment advisory with digitization. Invest-Techs, a subset of FinTechs, offer personalized investment and financial advice by using technology as a major part for their day-to-day business.
Figure 11: Demat accounts opened in India (crores)
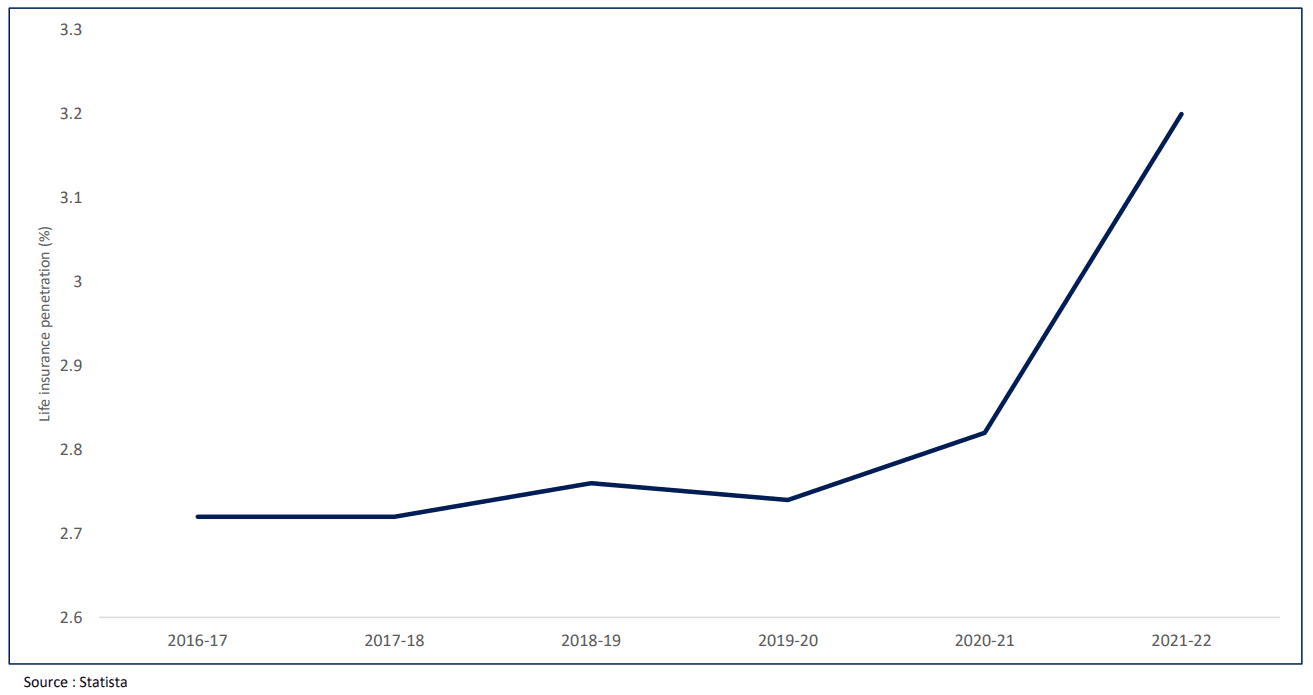
Similarly, in case of insurance, India has one of the lowest life insurance penetrations (premium paid as a share of GDP). However, post-Covid, there was a steady rise in demand for life insurance products and InsurTech can play a vital role in meeting the augmented demand and improving service qualities in far-flung areas of the country. From a stagnant insurance penetration till FY19, the penetration rate saw a huge spike post FY20, rising to 3.2% in FY21. This growing demand for life insurance products lays ground for the growth of InsurTechs, that are focused on providing personalized and digital insurance products. Policybazaar is a pioneer in the InsurTech space with a market share of 93.4% (FY20).
Figure 12: Life insurance penetration (premium paid to GDP) in India:
As the number of FinTechs in India grow, policies to regulate the sector are expected to grow as well. It remains to be seen whether these policies act as impediments or help the sector grow further.
Data protection, a key concern highlighted by the RBI in its report by the Working Group on FinTech and Digital Banking is still a work in progress as there is no standalone data protection law in the country. Although the Ministry of Electronics and Information Technology introduced the Personal Data Protection Bill in 2019, which provided a framework for protecting personal information of citizens and barring technology firms from procuring, storing, and processing such information without individuals’ consent, it doesn’t provide any comprehensive set of guidelines for the FinTech sector. Developing a regulatory environment for FinTechs will be a based on several nuanced exercises examining multiple factors like user preferences, differences in operations and usage in India vs other jurisdictions as well as the opportunity-costs of some of these services in an emerging economy like India. Learnings from such exercises will facilitate in the development of a growth focused regulatory oversight that can effectively nurture this emerging sector while fostering a stable Indian financial system.
As the Indian FinTech sector traverses from its nascency to a full grown segment, TruBoard Partners is well equipped to support them along the way. Our diversified offerings across the value chain of financial services are designed to optimize revenue generation of Indian lenders including new age FinTechs. Some of the avenues where we compliment and augment FinTechs include:
Boosting retail loan collections footprint across the country, enabling our clients to expand geographic coverage.
Assist established and new FinTechs in accessing capital through our network of marquee investors, both in India and abroad.
Business strategy support including transfer pricing, treasury management
Business development through lead generation from within our vast network.
Author: Debopam Chaudhuri, Head of Research and Ratings Ria Rattanpal, Research Associate Komal Chavan, Marketing Associate+91-9819239926 dc@truboardpartners.com
Disclaimer
The data and analysis covered in this report of TruQuest has been compiled by TruBoard Pvt Ltd and its associates (TruBoard) based upon information available to the public and sources believed to be reliable. Though utmost care has been taken to ensure its accuracy, no representation or warranty, express or implied is made that it is accurate or complete. TruBoard has reviewed the data, so far as it includes current or historical information which is believed to be reliable, although its accuracy and completeness cannot be guaranteed. Information in certain instances consists of compilations and/or estimates representing TruBoard’s opinion based on statistical procedures, as TruBoard deems appropriate. Sources of information are not always under the control of TruBoard. TruBoard accepts no liability and will not be liable for any loss of damage arising directly or indirectly (including special, incidental, consequential, punitive or exemplary) from use of this data, howsoever arising, and including any loss, damage or expense arising from, but not limited to any defect, error, imperfection, fault, mistake or inaccuracy with this document, its content.